Invisible Event Chains: Why You Can't Debug What You Can't See
Your player dies. A death sound plays. A ragdoll activates. A UI popup shows "You Died." The game auto-saves. An analytics event fires. A respawn timer starts counting down. That's six different systems, all responding to one event: OnPlayerDeath. But here's my question — WHERE is that documented?
Not in your code. Not in your project management tool. Not in any diagram. It exists in one place: inside the head of whoever originally set it up. And if that person left the team six months ago, it exists nowhere.
This is the dirty secret of event-driven architecture. We adopt it because it decouples our systems. We celebrate that our AudioManager doesn't need a reference to our UIManager. But we never talk about the cost: the flow of execution becomes invisible. And invisible things are, by definition, impossible to debug visually.
The Visibility Problem Is Worse Than You Think
Let's be honest about what "invisible event chains" actually means in practice. It's not an abstract architectural concern. It manifests in very concrete, very painful ways.
The Grep Ritual
A new developer joins your team. First week. They're looking at a bug where the death screen doesn't appear sometimes. They ask you: "What happens when the player dies?"
You know the answer involves OnPlayerDeath. So they grep the codebase. They find 20 files that reference that event name. Some are subscriptions. Some are unsubscriptions. Some are comments. Some are in dead code that was "temporarily" disabled eight months ago. They spend an hour sorting through the results, building a mental map of the chain.
Then you mention: "Oh, there's also a UnityEvent on the PlayerHealth component that fires OnDeath." That's a different subscription mechanism. Grep didn't find it because the string "OnPlayerDeath" doesn't appear anywhere near it — it's wired up in the Inspector, serialized in a scene file.
Another hour gone. And they still aren't sure they found everything.
The Chain-of-Chains Problem
Here's where it gets really ugly. OnPlayerDeath triggers OnDisableInput, which triggers OnPauseEnemyAI. OnPlayerDeath also triggers OnStartRespawnSequence, which triggers OnFadeToBlack, which triggers OnLoadCheckpoint, which triggers OnResetEnemyPositions.
Event A triggers B, which triggers C and D. D triggers E and F. F triggers G.
Try tracing that chain in code. You find the subscription to OnPlayerDeath in InputManager.cs. That handler raises OnDisableInput. So you search for subscriptions to OnDisableInput. You find one in EnemyAIController.cs. That handler raises... nothing? Or does it? You check. It raises OnAIPaused but only if a certain flag is set. So the chain branches conditionally.
Now multiply this by the respawn sequence running in parallel. And the audio chain. And the analytics chain.
This is a directed acyclic graph of event relationships, and you're trying to reconstruct it by reading individual files. It's like trying to understand a city's road network by reading individual street addresses.
The Onboarding Tax
Every new team member pays the same tax. "What happens when X?" requires a guided tour through the codebase. I've seen onboarding documents with sections like "Event Flow: Player Death" that list 15 bullet points of what fires in response to what. Those documents are outdated by the second sprint.
The problem isn't that your team is bad at documentation. The problem is that event flows aren't documentable in text form. They're graphs — nodes and edges, branches and merges, parallel and sequential paths. Describing a graph in a bullet list is like describing a circuit diagram in prose. You can do it, but nobody can actually use it.
The Sequence Coordination Nightmare
Some of those six death responses should happen simultaneously. The death sound and the ragdoll should start at the same time — there's no reason to wait for one before starting the other. But the screen fade MUST happen before the respawn load. The respawn load MUST finish before the teleport. The teleport MUST finish before the fade-in.
Parallel AND sequential, in the same flow.
In Unity, expressing this means coroutines. Coroutines calling coroutines. Callbacks tracking whether the fade finished. A _isRespawning bool that gates input. A _fadeComplete flag that triggers the next step. Maybe a state machine with DeathState, FadingState, LoadingState, TeleportingState, FadingInState.
All of which is invisible. All of which is fragile. Change the order of two steps and you're refactoring the coroutine chain. Add a new step and you're praying you inserted it in the right place. Remove a step and you hope nothing downstream depended on the timing.
What Other Domains Figured Out
Here's what frustrates me. Other software domains solved this problem ages ago.
CI/CD pipelines? You can see every step, every dependency, every parallel branch in a visual pipeline editor. GitHub Actions, Jenkins Blue Ocean, GitLab CI — they all show you the DAG.
Data engineering? Apache Airflow shows your data pipeline as a directed graph. Every task, every dependency, every conditional branch, visible at a glance.
Web development? Chrome DevTools shows you the request waterfall. Every network call, its timing, its dependencies, all visual.
Microservice architectures? Distributed tracing tools like Jaeger and Zipkin show request flows across services as visual timelines.
Game event systems? Nothing. You get Debug.Log and grep. That's it. Until now.
GES's Flow Graph Editor: Making Event Chains Visible
The GES Flow Graph Editor takes event relationships that used to exist only in code (or in your head) and renders them as a visual node graph. Events are nodes. Relationships are connections. The entire flow is visible in one place.
Let me be clear about what this is NOT. It's not visual scripting. It doesn't replace your C# game logic. Your AudioManager still plays sounds in C#. Your UIManager still manages screens in C#. The Flow Graph Editor visualizes the RELATIONSHIPS between those systems — when Event A fires, which other events respond, in what order, with what conditions.
Think of it as the conductor's score for your game's event orchestra. The individual instruments (your C# scripts) play their parts. The score (the flow graph) shows when each one plays, how they relate, and how the whole piece fits together.
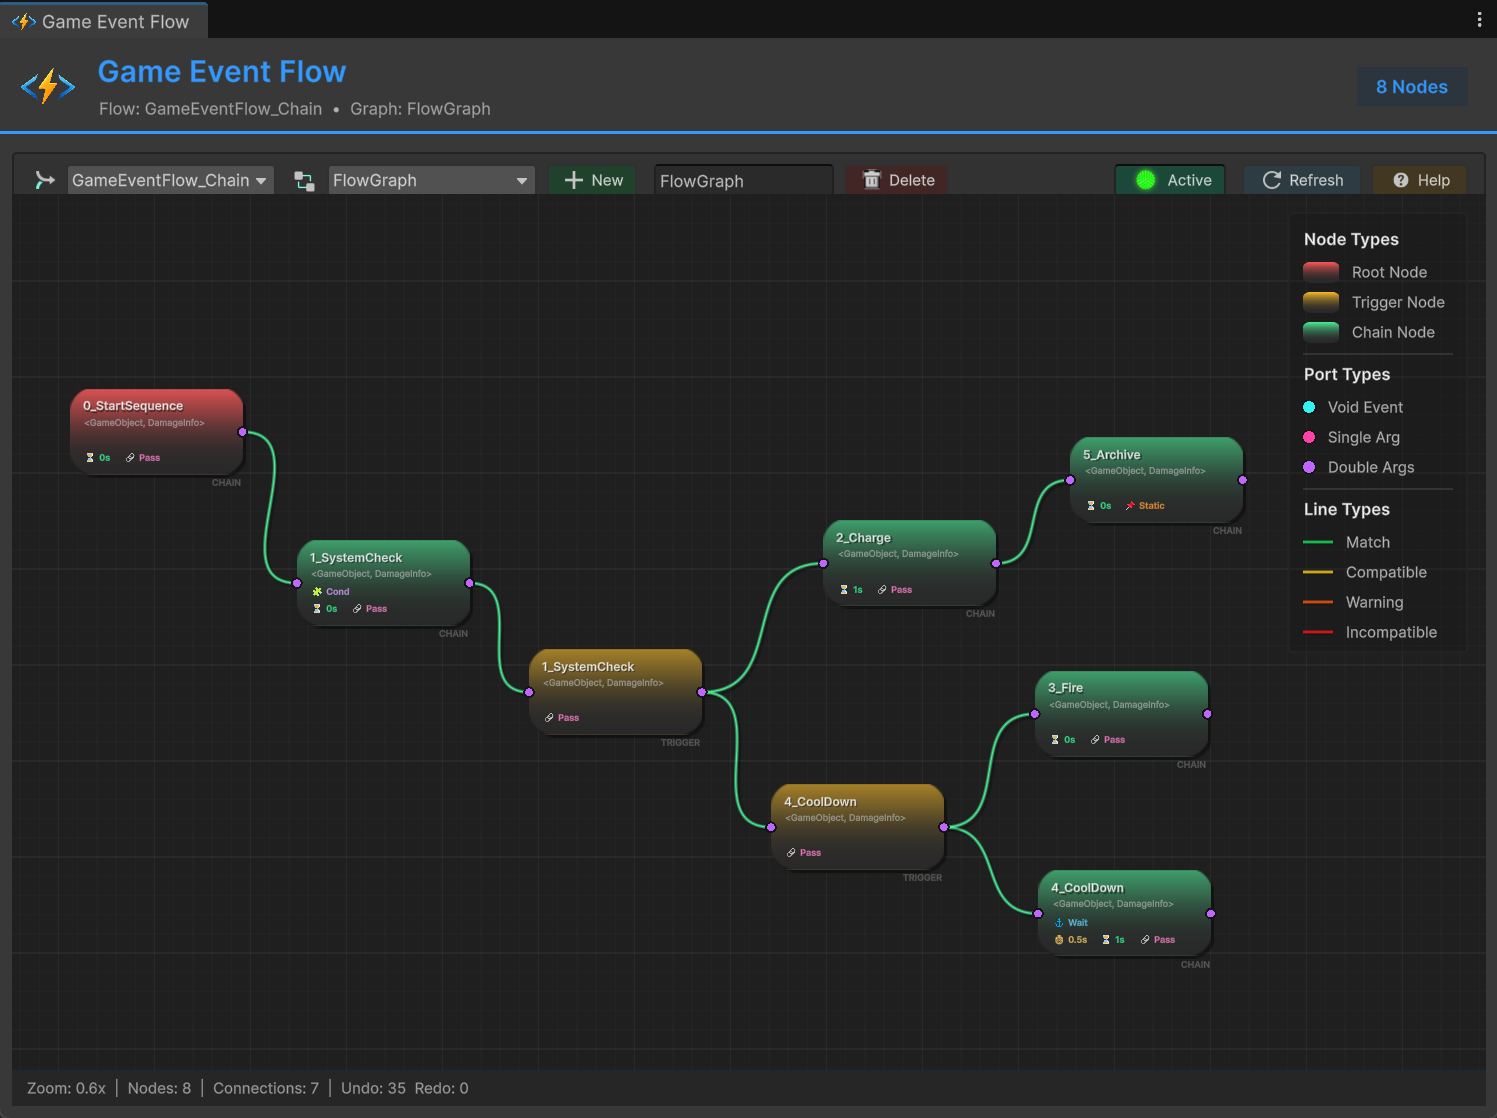
Two Fundamental Patterns: Trigger and Chain
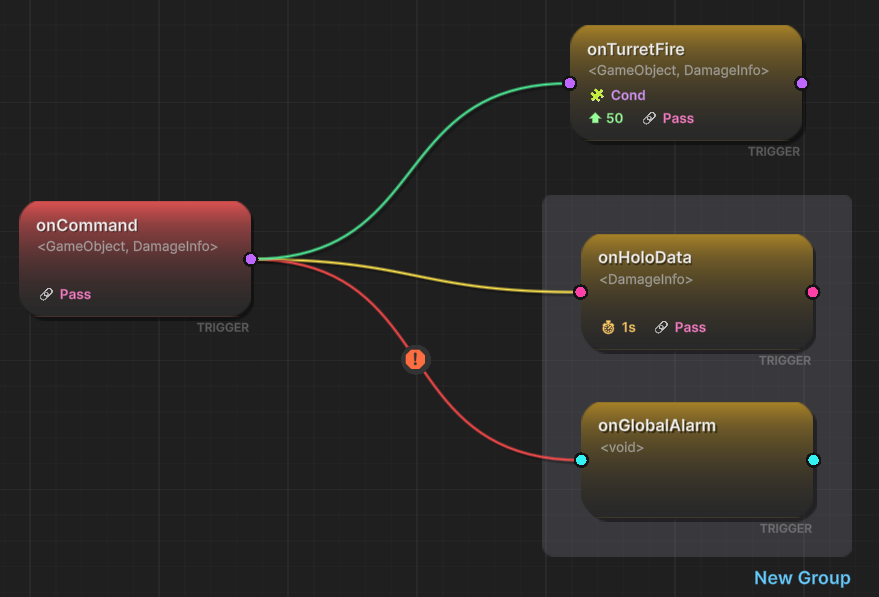
Every event flow in games boils down to two execution patterns, and the Node Editor makes them visually distinct.
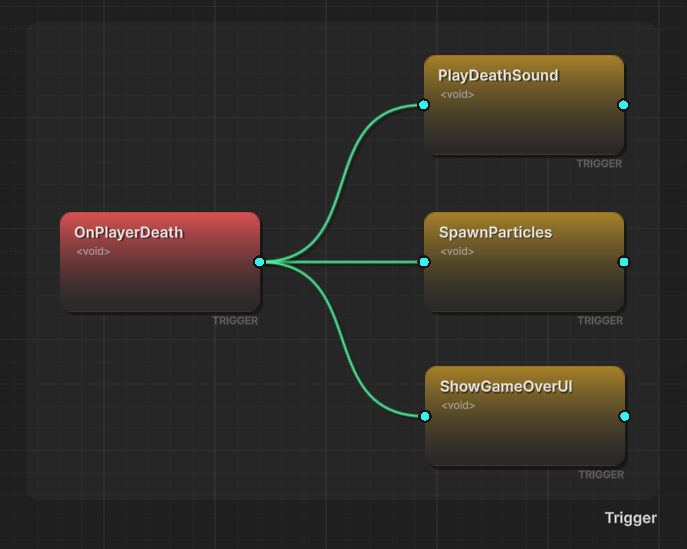
Trigger (Parallel, Orange): When a source event fires, all connected targets fire simultaneously. Fire-and-forget. If one target fails, the others still execute. This is your "play sound AND spawn particles AND update UI" pattern.
Chain (Sequential, Green): When a source event fires, connected targets execute one after another, in strict order. Each step waits for the previous one to complete. This is your "fade screen THEN load scene THEN teleport player" pattern.
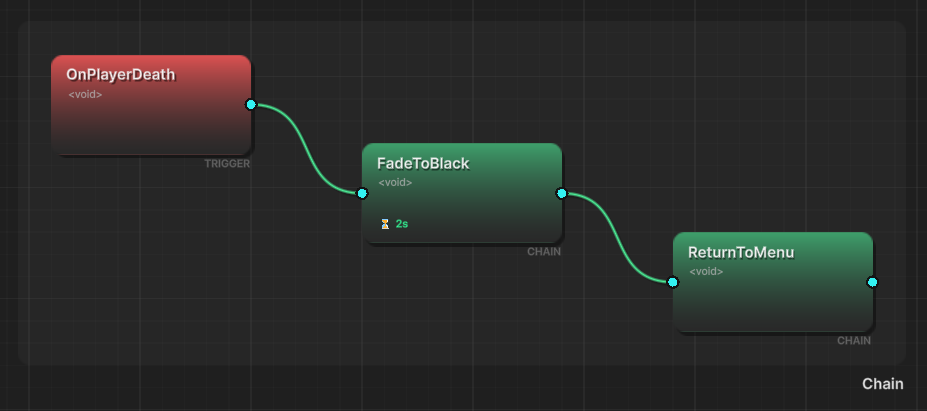
The visual distinction is immediate. Orange lines fan out — parallel. Green lines flow in sequence — sequential. Anyone can look at the graph and instantly understand the execution model. No code reading. No mental tracing. Just follow the lines.
And yes, you can mix them. The player death flow from the opening? Three orange trigger lines (sound + ragdoll + analytics, parallel) alongside a green chain sequence (fade → load → teleport → fade in, sequential). The visual layout makes the parallel/sequential split obvious at a glance.
Canvas Navigation
The editor is an infinite canvas. Pan with middle mouse or Alt+left drag. Zoom with scroll wheel. Press F to frame all nodes into view, or frame just your selection. A toolbar along the top provides save, search, minimap toggle, grid snapping, and debug mode.

Right-click on empty space to add nodes. Right-click on a node for per-node options. Right-click on a connection to configure it. The context menus are contextual — you get different options depending on what you clicked.
Building a Flow Graph
Creating a flow works like you'd expect in any node editor:
- Right-click the canvas and add nodes for each event in your project
- Click and drag from an output port to an input port to create a connection
- Choose whether the connection is Trigger (parallel) or Chain (sequential)
- Configure connection properties — conditions, argument transformers, timing
Each node shows the event name, argument type, and input/output ports. Connection lines show the execution type (trigger vs chain) through color coding. During configuration, the editor validates type compatibility between connected events and warns you about mismatches.
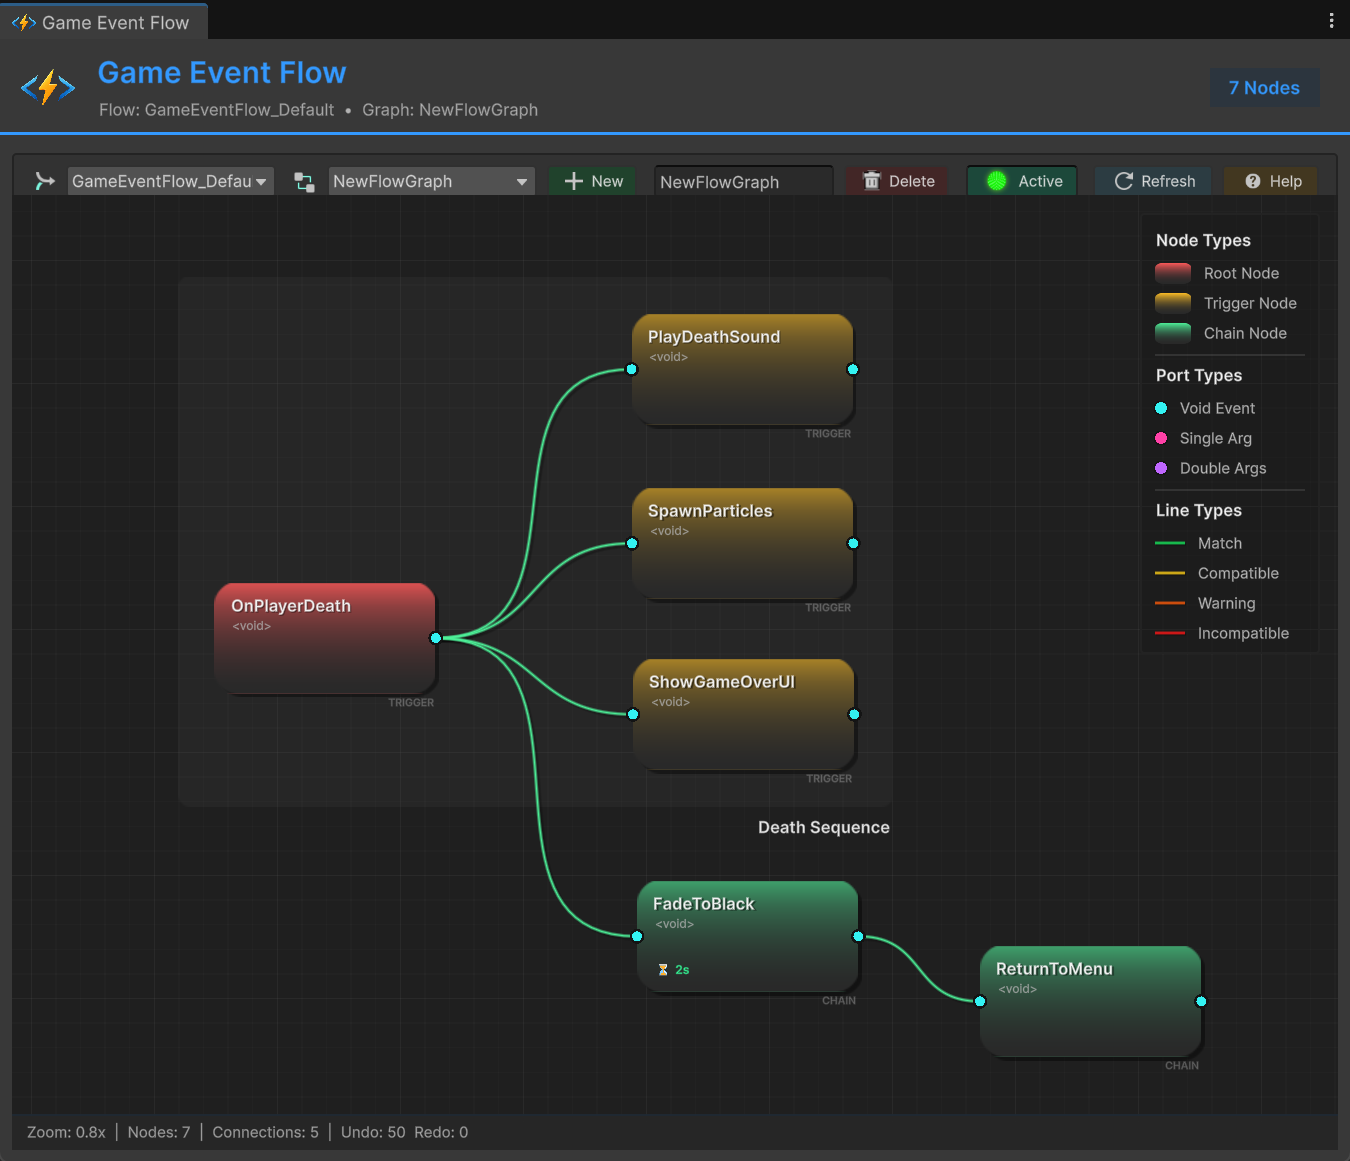
Groups for Organizing Complex Flows
A 50-node graph without organization is worse than the code it replaced. The group system fixes this. Select nodes, right-click, create a group. Give it a name — "Player Death Flow," "Audio Events," "Boss Phase 2." Assign a color. Now your graph has visual regions that communicate domain boundaries at a glance.
Groups are purely organizational — they don't affect execution. But they're essential for readability. I recommend establishing team color conventions early: blue for system events, green for gameplay, orange for UI, purple for audio. When your graph uses consistent colors, you can zoom out to a high level and immediately understand the structure without reading a single node label.
Groups support nesting too. A "Boss Fight" group can contain "Phase 1," "Phase 2," "Phase 3" sub-groups. Each phase can contain "Effects" and "Gameplay" sub-sub-groups. This hierarchical organization scales to flows with hundreds of nodes.
Runtime Visualization: Watch Your Flow Execute
This is the feature that changes everything. When you enter Play Mode with the Node Editor open and debug mode enabled, the graph comes alive.
Active nodes pulse when their event fires. Connection lines animate to show data flowing from source to target. Chain steps highlight in sequence as each one executes. Failed conditions flash red on the connections they blocked. You can literally WATCH your event flow execute in real time.
Remember the player death debugging scenario from the beginning? Open the graph. Die. Watch. The OnPlayerDeath node lights up. Orange lines animate to the sound and ragdoll nodes simultaneously. The green chain progresses through fade, load, teleport, fade-in. If the death screen doesn't appear, you see exactly which node didn't fire and why — maybe a condition blocked it, maybe a connection is missing, maybe the chain broke at an earlier step.
This is the difference between reading console output that says "OnPlayerDeath fired" and "OnFadeToBlack fired" and trying to reconstruct timing in your head, versus watching the entire flow execute visually in real time.
The debug visualization adds roughly 0.5-1ms per frame of overhead, which is fine for development. It's automatically disabled in builds — zero runtime cost in your shipped game.
The Real Point
The Node Editor isn't about replacing code. It's about solving the visibility problem that every event-driven architecture suffers from. Your C# scripts are the implementation. The flow graph is the map.
Every other mature software domain has visual tooling for understanding execution flow. Game development is finally catching up.
When a new developer asks "What happens when the player dies?" you don't spend two hours walking them through code anymore. You open the graph. You point at the screen. "This happens."
That alone is worth it.
🚀 Global Developer Service Matrix
🇨🇳 China Developer Community
- 🛒 Unity China Asset Store
- 🎥 Bilibili Video Tutorials
- 📘 Technical Documentation
- 💬 QQ Group (1071507578)
🌐 Global Developer Community
📧 Support & Collaboration