Zero Reflection, Zero GC: What 'High Performance' Actually Means for a Unity Event System
Every single event system plugin on the Unity Asset Store says "high performance" somewhere in its description. It's right there between "easy to use" and "fully documented." But here's the thing — 1ms and 0.001ms are both fast in human terms, yet one is a thousand times slower than the other. When a plugin says "high performance," what does that actually mean? Compared to what? Measured how?
I used to not care about this. Most of us don't. You wire up some events, the game runs fine on your dev machine, you ship it. But then I started working on a mobile project with hundreds of entities each listening to multiple events, and suddenly "high performance" wasn't a marketing checkbox anymore — it was the difference between 60 FPS and a slideshow.
This post is about what "high performance" should actually mean for an event system, why most implementations fall short, and how GES achieves near-zero overhead through Expression Tree compilation. With real numbers, not hand-waving.
The Measurement Problem
Here's a question: when was the last time you profiled your event system?
Not your rendering pipeline. Not your physics. Your event system. The thing that connects your game logic together. Most developers never do, because event overhead is invisible in small projects. You've got 20 listeners, maybe 5 events firing per frame — the cost rounds to zero and the profiler doesn't even bother showing it.
But games scale. That cute little prototype with 20 listeners becomes a production game with 500 event types and thousands of listeners distributed across multiple scenes. Mobile games, VR experiences, games with lots of AI entities — these all hit the point where event system overhead stops being "basically free" and starts eating real frame budget.
The reason most developers don't measure is simple: on desktop hardware with a beefy CPU, the overhead is hidden behind your frame budget headroom. It only becomes visible when you target platforms with tight budgets — 16.67ms for 60 FPS mobile, 11.1ms for 90 FPS Quest VR, 8.3ms for 120 FPS PSVR2. On these platforms, every tenth of a millisecond matters.
The Hidden Costs Nobody Talks About
So what makes one event system slow and another fast? There are four main cost categories that separate a performant event system from a sluggish one. Let's break them down.
Cost #1: Reflection
This is the big one. Reflection in .NET — using GetType(), GetProperty(), GetMethod(), Invoke() — is roughly 50-1000x slower than a direct method call, depending on the operation.
Here's what's wild: UnityEvent uses reflection on every invocation. Not just during setup — every time you raise a UnityEvent, it internally uses reflection to invoke the target methods. Unity has optimized this over the years, but the fundamental overhead remains. Go profile it if you don't believe me. Open the deep profiler, raise a UnityEvent a few thousand times, and watch the System.Reflection calls pile up.
// What a typical reflection-based event plugin does behind the scenes
public bool EvaluateCondition(ConditionNode node)
{
    // Step 1: Get the target component via reflection
    var component = target.GetComponent(node.componentType);  // Reflection

    // Step 2: Get the property/field via reflection
    var property = component.GetType().GetProperty(node.propertyName);  // Reflection

    // Step 3: Get the value via reflection
    object value = property.GetValue(component);  // Reflection + boxing

    // Step 4: Compare via reflection
    return CompareValues(value, node.comparisonValue, node.comparisonType);  // Unboxing
}
Every single step involves reflection. And if you have a visual condition system that checks properties at runtime — "is the player's health below 30?" — it's probably doing exactly this, multiple times per frame, on every active listener.
Cost #2: Boxing and Unboxing
When a reflection call returns a value type (int, float, bool, Vector3) as an object, .NET allocates a small heap object to wrap it. That's boxing. When you cast it back, that's unboxing. The allocation itself is cheap, but it feeds the garbage collector.
Event systems that pass data as object types — and many do, to stay "generic" — box every value type parameter. Every frame. Every event. Every listener.
Cost #3: GC Allocation
This is the silent killer on mobile. An event system that allocates memory on every raise creates garbage. That garbage accumulates until the GC runs a collection cycle, which on Unity's Mono runtime causes a visible stutter — a frame spike that players notice as a hitch or freeze.
The problem compounds: the more events you fire, the more garbage accumulates, the more frequently the GC runs, the more stutters you get. It's a death spiral that gets worse as your game gets more complex. In VR, a single GC spike can cause a dropped frame that makes players nauseous. Literally.
Cost #4: String Matching
Some event systems identify events by string keys. "OnPlayerDeath", "OnEnemySpawned", "OnHealthChanged". Every time an event fires, the system does a string comparison (or dictionary lookup, which involves hashing) to find the matching listeners.
String-based lookups with dictionary hashing are fast enough for small numbers of events. But they prevent the compiler from doing type checking, they can't be renamed safely, and they allocate when you construct the lookup key (substring operations, string concatenation for composite keys, etc).
The GC Problem Deserves Its Own Section
Let me be specific about why GC matters so much for event systems in particular.
Consider a game running at 60 FPS with 50 events firing per frame. If each event raise allocates even 64 bytes (a single boxed float, a temporary delegate, a small string), that's 3,200 bytes per frame. Sounds tiny, right? But that's 192KB per second. The Mono GC's incremental collector on mobile will trigger a collection roughly every 1-4MB of allocation, meaning you get a GC spike every 5-20 seconds. Each spike is 1-5ms, which at 60 FPS means a dropped frame.
Players notice this. Testers report "occasional stuttering." QA files bugs that nobody can reproduce consistently because the timing depends on allocation patterns. Sound familiar?
A zero-allocation event system eliminates this entire category of problems. Not "reduces" — eliminates. Zero bytes allocated means zero GC pressure from events, period.
The Condition Evaluation Problem
Here's where it gets really interesting. An event system that just dispatches callbacks is relatively easy to make fast — native C# events/delegates are already quick. The hard problem is condition evaluation in visual systems.
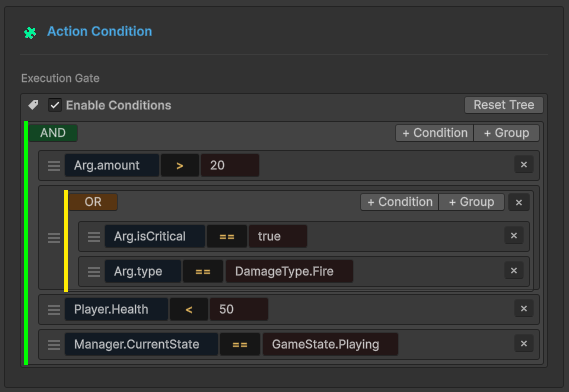
Visual event editors let designers build condition trees: "Fire this response when the player's health is below 30 AND they're grounded OR they have a shield." Beautiful in the editor. But at runtime, those visual nodes need to actually read properties from components and evaluate comparisons.
Most visual systems use reflection to do this. Every frame, for every active condition, the system calls PropertyInfo.GetValue() to read the current value, boxes it, compares it, and returns the result. A moderately complex game might evaluate 20-50 conditions per frame. At the reflection overhead we discussed — roughly 0.05-0.08ms per reflection call, with 3-4 calls per condition — you're looking at 3-16ms per frame just for condition checks.
That's potentially your entire frame budget on mobile, spent before any game logic even runs.
What "Zero Overhead" Should Actually Mean
Here's my definition, and I think it should be the industry standard:
A zero-overhead event system costs no more than a direct method call plus the actual work your listeners do.
That means:
- Raising an event with zero listeners costs essentially nothing
- The per-listener dispatch cost is equivalent to calling a delegate directly
- Condition evaluation is as fast as hand-written
ifstatements - Zero bytes of GC allocation per frame from event operations
- No reflection at runtime. Period.
If an event system can't meet these criteria, it's not "high performance" — it's just "not visibly slow on desktop hardware yet."
The Compromise That Shouldn't Exist
Native C# events give you raw speed — direct delegate invocation, no allocation, no reflection. But they give you nothing else. No visual editor, no condition trees, no flow graphs, no runtime debugging tools. Just code wiring code to code.
UnityEvents give you Inspector integration, visual binding, scene-level event wiring. But they use reflection under the hood. They're slower. They allocate. They don't support complex condition logic natively.
The conventional wisdom is that you pick one: raw speed or visual convenience. You can't have both. But that's only true if you accept reflection as the mechanism for bridging visual configuration to runtime behavior.
What if you could compile the visual configuration into native code?
Expression Tree Compilation: The Bridge
This is the core technical innovation in GES. Instead of interpreting visual conditions through reflection at runtime, GES compiles them into native delegates at initialization using .NET Expression Trees.
Expression Trees are a .NET feature (the System.Linq.Expressions namespace) that lets you represent code as data — a tree of expression nodes — and then compile that tree into executable IL code via the JIT compiler. The result is a delegate that runs at the same speed as hand-written C#.
Here's the conceptual pipeline:
Visual Condition Tree → Expression Tree → IL Code → Compiled Lambda
And here's what that looks like in simplified code:
// Instead of this (reflection every frame):
object value = propertyInfo.GetValue(target);  // Slow. Allocates. Every frame.

// GES builds an Expression Tree at initialization:
var targetParam = Expression.Parameter(typeof(MyComponent), "target");
var propertyAccess = Expression.Property(targetParam, "Health");
var lambda = Expression.Lambda<Func<MyComponent, float>>(propertyAccess, targetParam);

// Compiles it once to a native delegate:
Func<MyComponent, float> getHealth = lambda.Compile();

// Then calls it every frame — zero reflection:
float health = getHealth(myComponent);  // Same speed as: myComponent.Health
The compilation happens once during initialization. After that, getHealth is a JIT-optimized native delegate. It's functionally identical to writing myComponent.Health directly in your source code. No tree traversal. No interpretation. No reflection. Just a direct property access compiled to IL.
The Full Compilation Pipeline
Let me walk through how GES actually handles this end-to-end.
Stage 1: Visual Configuration (Design Time)
In the GES editor, designers build condition trees visually. Each node is a condition — a property, a comparison operator, and a value. Nodes connect with AND/OR/NOT logic operators. At this stage, everything is serialized data. No code runs.
Stage 2: Expression Tree Construction (Initialization)
When the game starts or a listener activates, GES reads the serialized condition data and builds Expression Trees:
// Simplified version of GES internals
private Func<bool> CompileConditionTree(ConditionNodeData rootNode)
{
    Expression body = BuildExpression(rootNode);
    var lambda = Expression.Lambda<Func<bool>>(body);
    return lambda.Compile();
}

private Expression BuildExpression(ConditionNodeData node)
{
    if (node.isLogicalOperator)
    {
        var left = BuildExpression(node.children[0]);
        var right = BuildExpression(node.children[1]);

        return node.operatorType switch
        {
            LogicalOp.And => Expression.AndAlso(left, right),  // Short-circuit AND
            LogicalOp.Or  => Expression.OrElse(left, right),   // Short-circuit OR
            LogicalOp.Not => Expression.Not(left),
            _ => throw new InvalidOperationException()
        };
    }
    else
    {
        var target = Expression.Constant(node.targetComponent);
        var property = Expression.Property(target, node.propertyName);
        var compareValue = Expression.Constant(node.compareValue);

        return node.comparisonType switch
        {
            Comparison.Equals      => Expression.Equal(property, compareValue),
            Comparison.GreaterThan => Expression.GreaterThan(property, compareValue),
            Comparison.LessThan    => Expression.LessThan(property, compareValue),
            // ... etc
        };
    }
}
Note the use of Expression.AndAlso and Expression.OrElse — these compile to short-circuit evaluation, identical to what the C# compiler generates for && and ||. If the left side of an AND is false, the right side is never evaluated. This matters at scale.
Stage 3: IL Compilation (One-Time Cost)
The lambda.Compile() call invokes the .NET Expression Tree compiler, which emits IL bytecode and JIT-compiles it. This is the expensive step — roughly 0.1-2ms per tree depending on complexity. But it happens exactly once.
For a complex condition tree like:
AND
  ├── Health < 30
  └── OR
      ├── IsGrounded == true
      └── HasShield == true
The compiled delegate is functionally equivalent to:
(health < 30f) && (isGrounded || hasShield)
Same IL. Same performance. Same short-circuit behavior. Just generated from visual data instead of hand-written code.
Stage 4: Runtime Execution (Every Frame)
At runtime, condition evaluation is one delegate call:
if (compiledCondition())  // One call. No reflection. No traversal. No allocation.
{
    ExecuteResponse();
}
That's it. The entire visual condition tree — maybe 10 nodes with nested AND/OR logic and multiple property comparisons — is a single delegate call that runs as fast as the equivalent hand-written if statement.
What This Means in Practice
The compiled conditions handle edge cases that trip up naive implementations:
Null safety — destroyed component references are checked via compiled null guards, not try/catch blocks. The null check is baked into the delegate as a branch instruction.
No boxing — value type properties (int, float, bool, Vector3) are accessed directly through the compiled delegate. No object wrapper, no heap allocation, no GC pressure.
Deep property access — you can check player.Inventory.ActiveWeapon.Damage > 50 and the entire chain compiles to sequential property loads in IL, just like writing it in C#.
Hard Benchmark Data
Enough theory. Here are actual GES performance numbers from controlled benchmarks.
Event Raise Performance
| Scenario | Time | GC Allocation |
|---|---|---|
| Event Raise, 0 listeners | ~0.001ms | 0 bytes |
| Event Raise, 1 listener | ~0.003ms | 0 bytes |
| Event Raise, 10 listeners | ~0.02ms | 0 bytes |
| Event Raise, 100 listeners | ~0.15ms | 0 bytes |
| Event Raise, 1000 listeners | ~1.2ms | 0 bytes |
Zero GC allocation across the board. No boxing, no temporary objects, no garbage pressure. At any listener count.
Condition Evaluation Performance
| Scenario | Time | GC Allocation |
|---|---|---|
| Simple condition (1 node) | ~0.001ms | 0 bytes |
| Complex condition (5 nodes, AND/OR) | ~0.003ms | 0 bytes |
| Deep condition tree (10+ nodes) | ~0.005ms | 0 bytes |
Compare this to reflection-based evaluation: a 5-node condition tree takes ~0.003ms with Expression Trees vs ~0.75ms with reflection. That's a 250x improvement.
Flow Node Execution
| Scenario | Time | GC Allocation |
|---|---|---|
| Single flow node | ~0.01ms | 0 bytes |
| Flow chain (5 nodes) | ~0.05ms | 0 bytes |
| Flow chain (10 nodes) | ~0.09ms | 0 bytes |
Monitor Window (Editor Only)
| Scenario | Time |
|---|---|
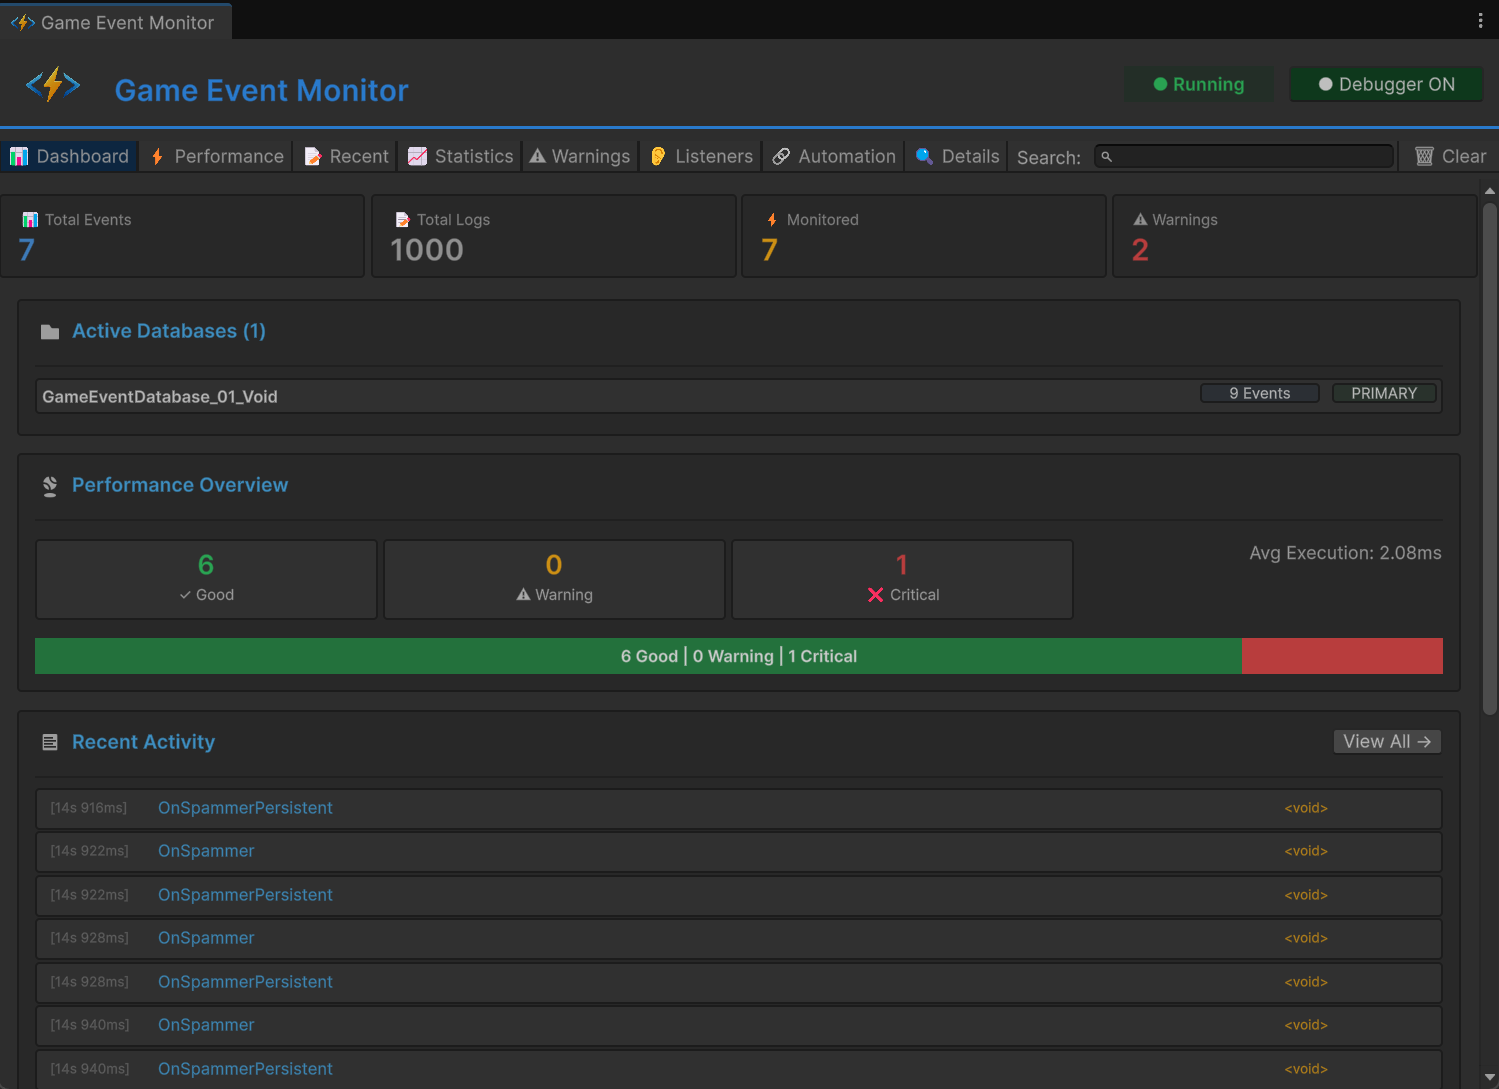
| Monitor dashboard refresh | ~0.3ms |
The Monitor Window is an editor tool — this cost exists only during development and doesn't affect builds.
Comparison: GES vs Everything Else
| Feature | GES | Native C# Events | UnityEvent | String-Based Systems |
|---|---|---|---|---|
| Raise overhead (10 listeners) | ~0.02ms | ~0.01ms | ~0.15ms | ~0.08ms |
| GC per raise | 0 bytes | 0 bytes | 32-128 bytes | 64-256 bytes |
| Visual condition editor | Yes | No | Limited | Varies |
| Condition eval speed | ~0.003ms | N/A (manual code) | N/A | ~0.5ms (reflection) |
| Reflection at runtime | None | None | Yes | Yes |
| Type safety | Full | Full | Partial | None |
| Runtime debugging tools | Yes | No | Limited | Varies |
The pattern is clear: GES matches native C# event speed while providing the visual tooling that C# events can't. And it crushes reflection-based systems on both speed and allocation.
Production Validation
These aren't synthetic benchmarks run in a vacuum. GES has been validated in production scenarios:
- 500+ simultaneous event types active in a single project
- 10,000+ listeners distributed across multiple scenes
- Zero frame drops attributable to the event system
- Zero GC spikes from event operations during gameplay
The initialization cost — Expression Tree compilation — is typically 50-200ms total at scene load, spread across all condition trees. This happens during the loading screen and is imperceptible to players. Lazy compilation means trees are compiled when a listener first activates, not all at scene start, so the cost is naturally distributed.
Scaling Strategies That Actually Work
Knowing the raw numbers is useful, but knowing how to keep them low at scale is more useful. Here are concrete strategies GES supports for large projects.
Database Partitioning
Instead of one monolithic event registry, partition events by domain: combat events, UI events, audio events, AI events. Each partition has its own listener list, so raising a combat event doesn't iterate through UI listeners. This keeps per-raise costs constant regardless of total listener count.
Conditional Listeners
Rather than every listener checking conditions and most returning false, GES evaluates conditions before invoking listeners. Listeners that fail their conditions are skipped entirely — no delegate invocation, no function call overhead. In a scenario where 100 listeners exist but only 5 have true conditions, you pay for 5 invocations, not 100.
OR Short-Circuit Evaluation
The compiled Expression Trees use OrElse, which short-circuits: if the first condition in an OR group is true, the rest are skipped. Design your condition trees with the most likely true-condition first in OR branches to minimize evaluation work.
SetInspectorListenersActive for Batch Operations
When you need to temporarily disable large groups of listeners — during a cutscene, a loading transition, a menu overlay — use SetInspectorListenersActive(false) instead of individually toggling listeners. This is a single call that prevents evaluation of all inspector-configured listeners on a component, avoiding the overhead of iterating through them one by one.
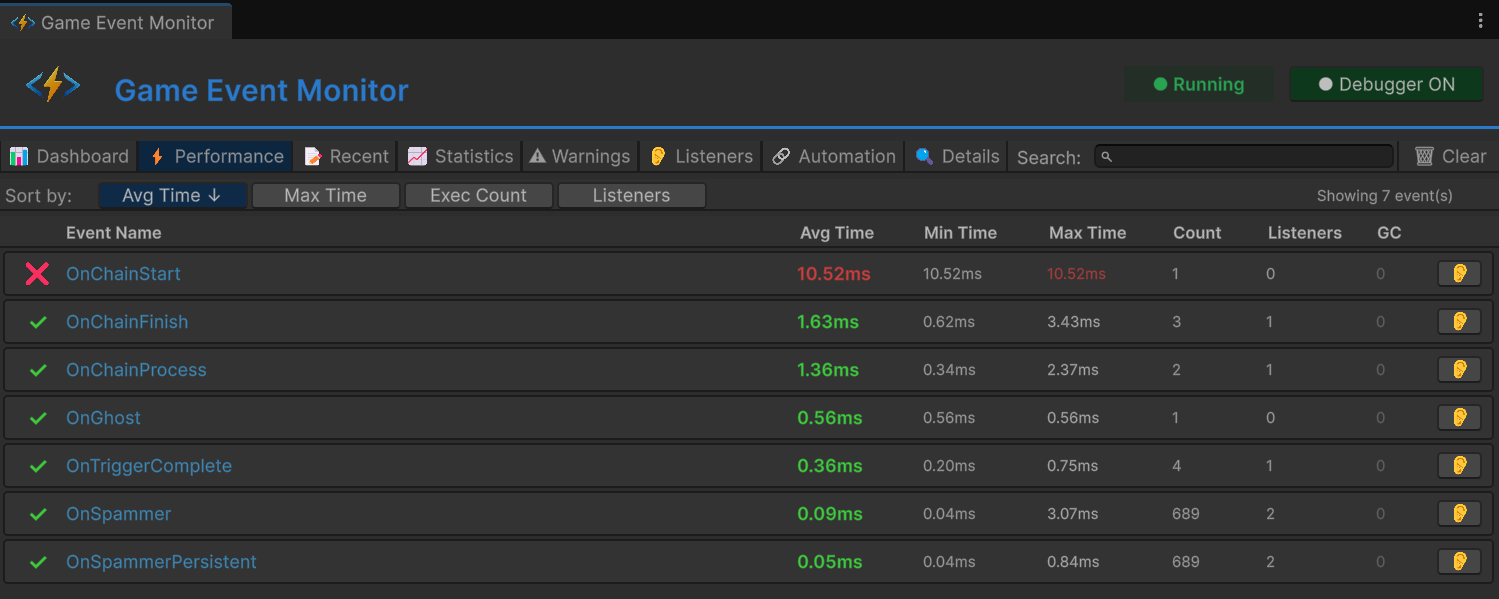
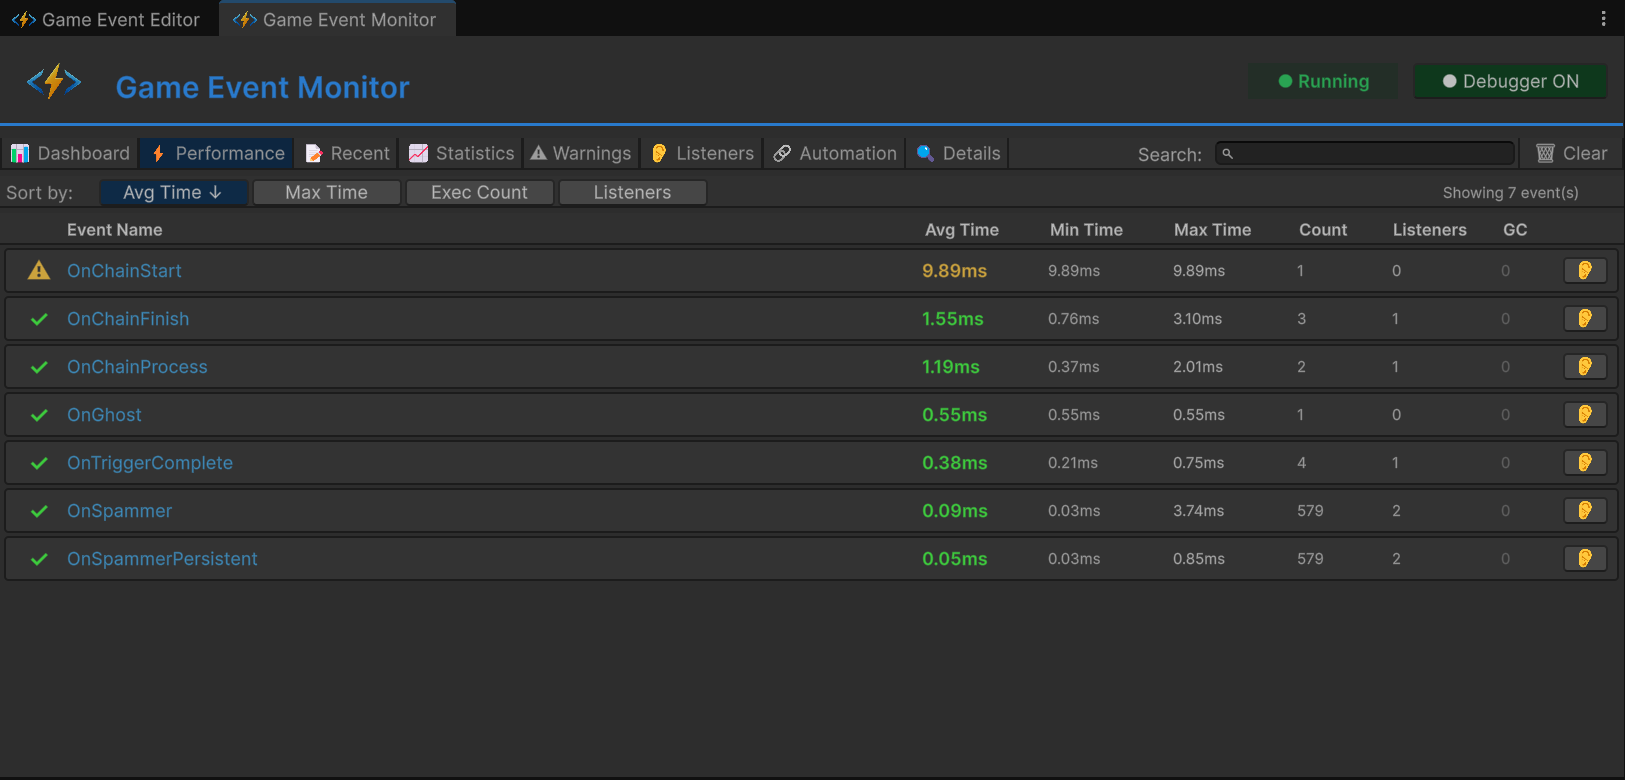
Monitor Dashboard for Profiling
Use the GES Monitor Window during development to identify hot event channels — which events fire most frequently, which have the most listeners, which conditions are most expensive to evaluate. Then optimize those first.
Why This Matters for Mobile and VR
Let me put concrete frame budget numbers on this.
Mobile (iOS/Android)
Mobile CPUs are 5-10x slower than desktop. A 0.5ms event overhead on desktop becomes 2.5-5ms on mobile. At a 60 FPS target (16.67ms budget), that's 15-30% of your budget on event overhead alone. With GES, the same workload costs 0.02-0.05ms on mobile. The difference is the difference between shipping and not shipping.
VR (Quest, PSVR2)
VR is the most demanding platform for frame budgets. Quest requires 90 FPS (11.1ms per frame). PSVR2 targets 120 FPS (8.3ms per frame). And VR games are event-heavy by nature — hand tracking generates events, gaze tracking generates events, physics interactions generate events, spatial audio triggers generate events. A reflection-based event system in VR is a guaranteed performance bottleneck. A zero-reflection system makes the event layer invisible in the profiler, which is exactly where it should be.
The GC Angle on Mobile
This deserves special emphasis. Unity's garbage collector on mobile (Mono runtime) is non-generational and stop-the-world. When it runs, everything freezes. The threshold for triggering a collection varies, but any per-frame allocation accelerates the cycle. In VR, a GC pause during head tracking causes a visible stutter that can induce motion sickness. An event system that generates zero garbage per frame is not an optimization — it's a hard requirement for VR shipping.
The Bottom Line
"High performance" is not a feature — it's a measurable property. When someone claims their event system is fast, the right questions are:
- How many microseconds per raise with N listeners?
- How many bytes allocated per frame?
- Does it use reflection at runtime? For what?
- How do conditions evaluate? Through reflection or compiled code?
GES answers these with: sub-microsecond raises, zero allocation, zero runtime reflection, and Expression Tree compiled conditions that run as fast as hand-written C#.
The zero-reflection approach isn't just a performance optimization. It's what makes visual event editing viable for production games — not just prototypes that work fine on your dev machine and fall apart on a Quest 3 with 200 active entities. When your event system is fast enough that you never think about its performance, you use it more freely. You add more events, more conditions, more listeners without worrying about frame budget. And that freedom to architect without fear is what actually makes your game better.
Performance isn't a luxury feature. It's the foundation that everything else is built on.
🚀 Global Developer Service Matrix
🇨🇳 China Developer Community
- 🛒 Unity China Asset Store
- 🎥 Bilibili Video Tutorials
- 📘 Technical Documentation
- 💬 QQ Group (1071507578)
🌐 Global Developer Community
📧 Support & Collaboration