Debugging the Invisible: Why Event Systems Need Their Own Observability Layer
A QA tester files a bug: "The door doesn't open when the player picks up the key."
Simple, right? Probably a missing reference or a wrong condition. You open the project, pick up the key, and... the door opens fine. Works on your machine. So you ask the tester for reproduction steps, and they say "it happens about 30% of the time, usually after a save/load cycle."
Now you're in debugging hell. Somewhere in the chain between the key pickup event, the inventory update, the quest progress check, and the door's unlock condition, something is failing intermittently. But which link? Was the event not raised? Was it raised but the listener wasn't subscribed? Was the listener subscribed but the condition evaluated to false? Was the condition correct but the door's state was stale after the load?
You don't know. And the event system won't tell you. It's "fire and forget" — emphasis on the forget.
This is the observability gap that every event-driven Unity project hits eventually. And it's not just a debugging inconvenience — it's an architectural blind spot that makes refactoring dangerous, performance tuning impossible, and onboarding new team members painful. Today I want to talk about WHY this gap exists, what it actually costs you, and what a proper solution looks like.
The "Was It Raised?" Question
The most basic debugging question in an event system is deceptively simple: did the event fire?
When PlayerCombat calls onDamageDealt.Raise(42), the event system iterates through listeners, calls their handlers, and returns. No log. No trace. No record that it happened. The information evaporates the moment the raise completes.
This is fundamentally different from direct method calls. If PlayerCombat.TakeDamage() calls HealthBar.UpdateDisplay() directly, you can set a breakpoint on the call site, step through the code, and see exactly what happens. With events, the caller doesn't know who's listening. The listeners don't know who's calling. The connection between them exists only at runtime, in the event system's subscription list, invisible to your debugger.
So you add a Debug.Log:
private void HandleDamage(int amount)
{
    Debug.Log($"HandleDamage called with amount={amount}");
    // actual logic...
}
This works for one event. Now multiply by every listener on every event in your project. You end up with 500 log lines per frame in the Console, scrolling faster than you can read. You try filtering by search term, but you spelled "Damage" differently in three different log statements. You add timestamps, then caller names, then stack traces. Each Debug.Log becomes three lines of formatting code wrapped around one line of actual logging.
And when you ship? You need to remove all of them. Or wrap them in #if UNITY_EDITOR blocks. Or leave them in and hope nobody notices the performance hit from string formatting 500 log messages per frame.
Debug.Log is a debugging strategy the same way a bucket is a plumbing strategy. It works in an emergency, but you wouldn't design a house around it.
Unity's Profiler: Wrong Tool for the Job
Unity's Profiler is excellent at answering "what method took how long." It is terrible at answering "what event fired, when, with what data, and who responded."
You see a spike in the Profiler. It's in some callback method — HandleDamage. You dig through the call stack. It was invoked by... the event system's dispatch loop. Which event? The Profiler doesn't know. It just sees a method call from a generic dispatch function. Which listener was slow? You'd need to instrument each one individually. What data was passed? The Profiler doesn't capture arguments.
The Profiler tells you WHERE time was spent. It doesn't tell you WHY your event system behaved the way it did. Those are fundamentally different questions.
One of your 8 listeners on OnPlayerDamaged is taking 4ms. The Profiler shows you a spike in the event system's dispatch method. Cool. Which of the 8 listeners is the culprit? You could wrap each listener in a Stopwatch and log the results. For 8 listeners. On one event. You have 60 events. That's 480 lines of timing code, and you haven't even started debugging yet.
The Dependency Question
Here's a question that keeps architects up at night: "Who's using this event?"
You want to rename OnPlayerDeath to OnPlayerDefeated because the game design changed and "death" doesn't happen anymore — the player gets "knocked out" instead. Simple rename, right?
You do Ctrl+F across the project: OnPlayerDeath. You find 12 code references. You rename them all. Ship it.
Then you get a bug report: the analytics system stopped tracking player defeats. Why? Because the analytics MonoBehaviour had a serialized field in the Inspector that referenced the old OnPlayerDeath ScriptableObject. Ctrl+F only finds code references. It doesn't find Inspector bindings. It doesn't find Behavior Window subscriptions. It doesn't find any reference that lives in a serialized Unity asset rather than a .cs file.
This is why nobody deletes events. Nobody renames events. Nobody refactors the event hierarchy. Because nobody knows the full picture. "Who's using this event?" is an unanswerable question with standard Unity tools. So events accumulate. Dead events sit in the project forever. The event database grows. New developers look at 200 events and have no idea which ones are active.
The fear of refactoring is real, and it's directly caused by the observability gap.
Recursive Loops That Freeze Your Game
Event A raises B. B's listener raises C. C's listener raises A. The game freezes. The editor becomes unresponsive. You force-quit Unity, lose your unsaved scene changes, and spend 20 minutes staring at code trying to figure out where the cycle starts.
Recursive event loops are one of the nastiest bugs in event-driven systems. They're invisible at design time — the cycle only manifests when all three events happen to be active simultaneously with the right listeners. They don't show up in code review because no single file contains the loop. Each script just raises one event in response to another. Perfectly reasonable in isolation. Catastrophic in combination.
Without automatic detection, you discover these loops the hard way: a frozen editor and a stack overflow.
What DevOps Has (And We Don't)
The backend development world solved this problem years ago. Distributed tracing (Jaeger, Zipkin) lets you follow a request through 15 microservices and see exactly where it spent time. Metrics dashboards (Grafana, Datadog) show you request rates, error rates, latency percentiles — in real time. Log aggregation (ELK stack, Splunk) lets you search across millions of log entries with structured queries. Alerting systems (Prometheus, PagerDuty) notify you BEFORE users complain.
Game events are architecturally similar to microservice messages. An event fires (a request is sent), multiple listeners respond (multiple services process it), and the results propagate downstream (trigger further events). The same observability techniques apply.
But Unity's toolbox gives us... the Profiler and Debug.Log. We deserve better.
GES's Answer: Two Complementary Tools
GES addresses the observability gap with two purpose-built tools that cover the full development lifecycle: Event Finder for edit-time dependency analysis, and Runtime Monitor for play-time observability. Together, they answer every question that standard Unity tools can't.
Event Finder: Who's Using This Event?
The Event Finder is an editor window that answers the dependency question definitively. Select any event asset, click Scan, and it finds every MonoBehaviour in the scene that references that event — through public fields, private serialized fields, and nested references. It uses reflection to scan component fields, so it catches references that Ctrl+F never would.
List View
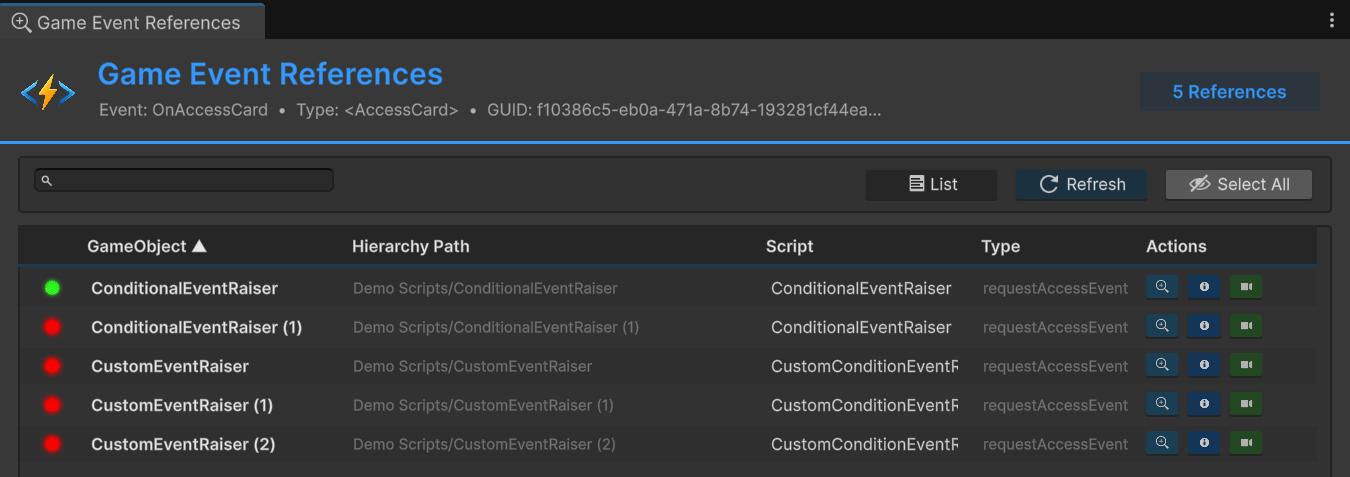
The List view shows all references in a flat list. Each entry displays the GameObject name, the component type, the field name, and a status indicator:
- Green — the reference is valid and the component is active
- Red — the reference is broken (null event, missing component, or disabled object)
Click any entry to Ping it in the Hierarchy (highlight without selecting), Focus it (select and frame in Scene view), or Frame it (move the Scene camera to center on the object).
Grouped View
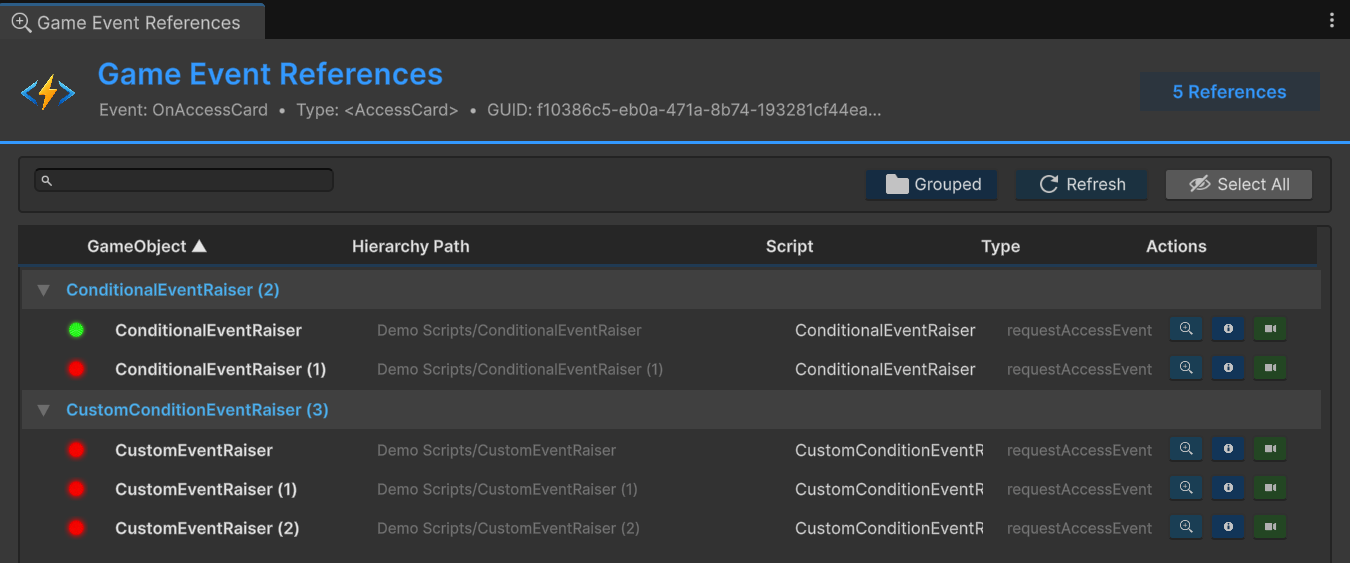
The Grouped view organizes references by component type. All HealthSystem references together, all DamagePopup references together. This is the view you want when answering "which SYSTEMS use this event?" rather than "which OBJECTS reference it."
The Safe Refactoring Workflow
Here's how the Event Finder turns "who's using this event?" from an unanswerable question into a 30-second lookup:
- Open Event Finder, select the event you want to rename/delete/modify
- Click Scan — get the complete reference list
- Review every reference in List view (check for unexpected consumers)
- Switch to Grouped view to understand which systems are affected
- Make your change with confidence
- Re-scan to verify nothing is broken (all Green status)
No guessing. No "I think we covered everything." No bug reports two weeks later because you missed an Inspector binding. The Event Finder makes refactoring safe by making dependencies visible.
Runtime Monitor: Purpose-Built Event Observability
The Runtime Monitor is an editor window with 8 specialized tabs, each designed to answer a specific category of debugging question. It understands events, listeners, conditions, timing, and flow graphs natively — because it's built into the event system, not bolted on after the fact.
Open it via Tools > TinyGiants > Game Event System > Runtime Monitor, or find it in the GES Hub. The monitor collects data during Play Mode with minimal overhead. It's editor-only code, completely stripped from builds. Zero impact on your shipping game.
Let's walk through all eight tabs.
Tab 1: Dashboard — The Health Check
The Dashboard is your starting point. Glance at it and know immediately whether your event system is healthy or on fire.
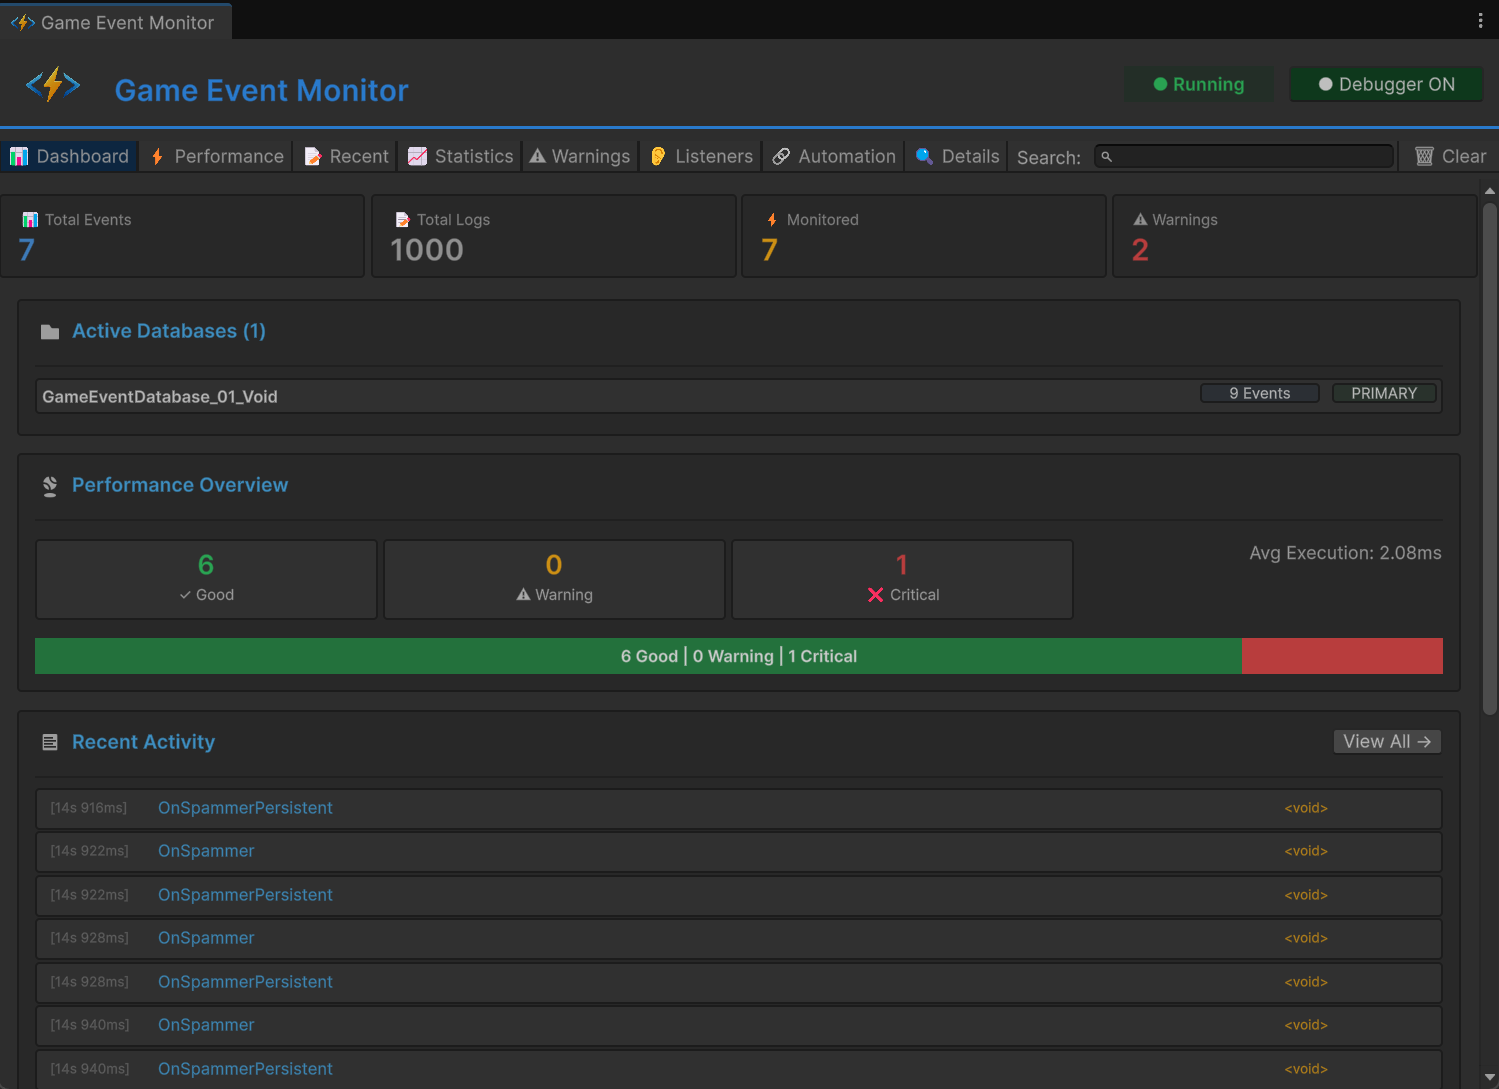
Metric cards across the top show the big picture: total events in the project, active events this session (raised at least once), total listener subscriptions, and cumulative raise count since Play Mode started.
The performance bar is color-coded. Green means all events are processing under 1ms average — you're fine. Yellow means some events average 1-10ms — worth a look. Red means something is over 10ms — stop and investigate. The bar reflects the WORST-performing event, not the average. One bad apple turns the whole bar yellow. Intentional — you want to know about outliers.
Recent activity shows the last few event raises scrolling by in real time: event name, timestamp, listener count, execution time. During gameplay, this gives you a live pulse of what your event system is doing.
Quick warnings summarize detected issues: high execution times, high listener counts, recursive raises, memory allocations. Click a warning badge to jump to the relevant detail tab.
The Dashboard answers: "Is my event system healthy right now?" If yes, move on with your day. If not, the other tabs tell you why.
Tab 2: Performance — The Hard Numbers
This is where you go when something feels slow and you need data, not feelings.
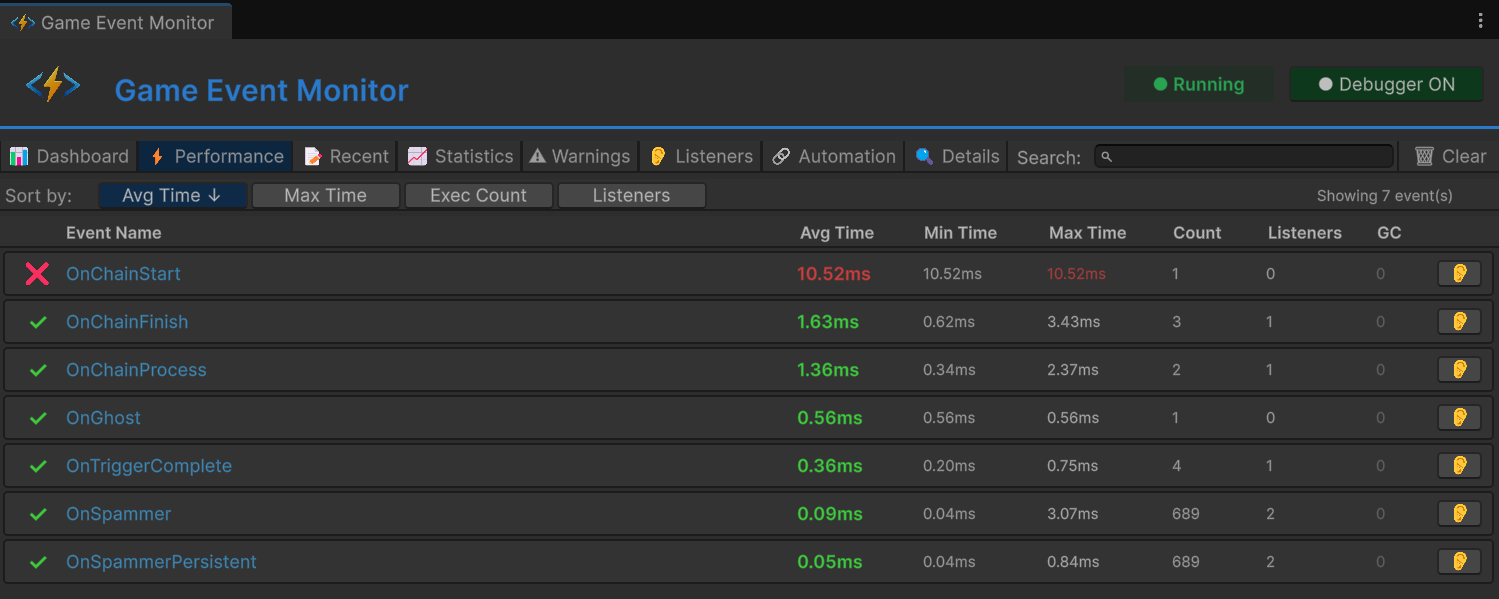
Every event in your project gets a row with:
- Event Name — the ScriptableObject asset name
- Raise Count — how many times it's fired this session
- Listener Count — current active subscribers
- Avg/Min/Max Time — execution time per raise, across all listeners
- GC Alloc — garbage collection allocations per raise
The time cells are color-coded: green (<1ms) is normal, yellow (1-10ms) is elevated, red (>10ms) is critical. Sort by any column — sort by "Max Time" to find spike culprits, sort by "GC Alloc" to find allocation hotspots, sort by "Raise Count" to identify high-frequency events.
Here's the insight that makes the Performance tab powerful: event execution time includes ALL listener work. If an event shows 5ms average with 50 listeners, that's ~0.1ms per listener — normal. If it shows 5ms with 2 listeners, one of those listeners is doing something expensive. The numbers immediately tell you whether the problem is "too many listeners" or "one listener is slow."
Tab 3: Recent Events — The Timeline
A chronological log of every event raise. This is your event system's flight recorder.
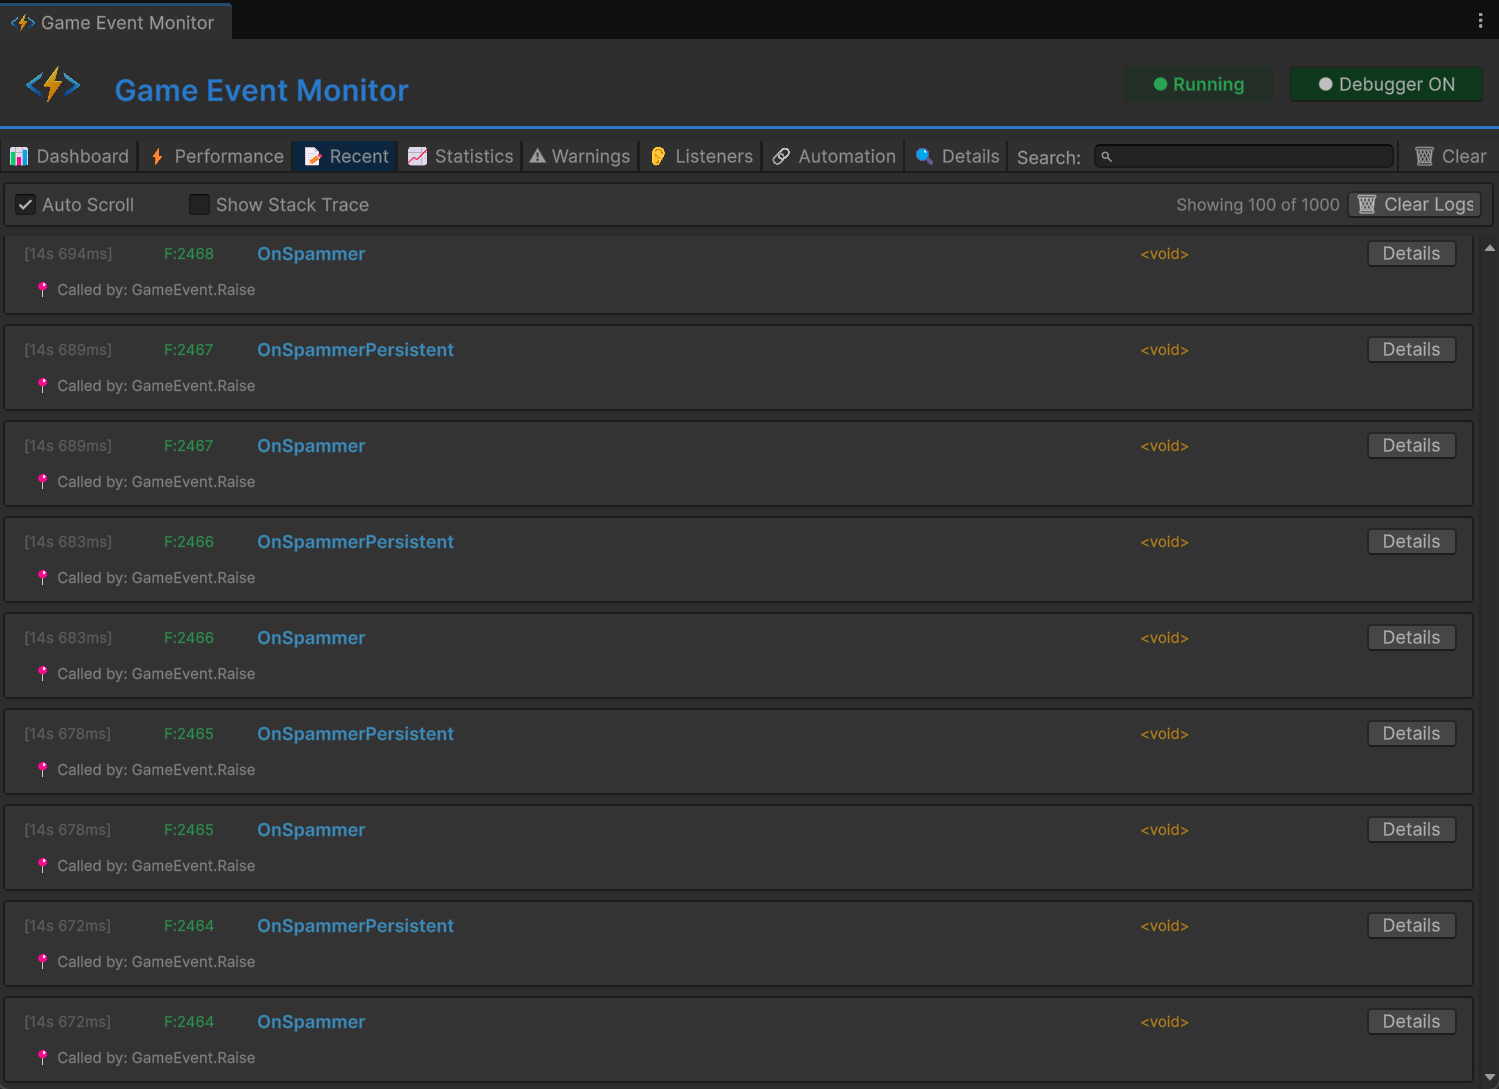
Each entry shows: timestamp (game time), event name, argument value (displayed as string), the caller script and method that called Raise(), listener count at time of raise, and execution time.
Click any entry for the full call stack. This is gold for answering "who raised this?" — especially when multiple systems can raise the same event:
PlayerCombat.TakeDamage() at PlayerCombat.cs:47
  -> Int32GameEvent.Raise(42)
Now you know the damage event came from the player combat system at line 47, with an argument of 42.
Filter by event name to watch a specific event in real time. Set it to OnKeyPickedUp and play through the key-pickup sequence. Is it there? When did it fire? What argument? If it's missing, the problem is upstream — the raiser never called Raise(). If it's present with the right data, the problem is downstream — check the Listeners tab.
Filter by time range (last N seconds) or by minimum execution time (to surface spikes only).
The Recent tab turns "did this event actually fire?" from a guessing game into a lookup.
Tab 4: Statistics — The Patterns
While Recent shows individual events, Statistics shows aggregate behavior over time.
Frequency analysis: total events per second (real-time), per-event frequency (raises per second and per minute), and a distribution histogram.
Usage patterns: most active events (sorted by total raise count), least active events (fired zero times — possible dead code), busiest moments (time periods with peak activity), and listener growth over the session.
This tab reveals things you'd never find with spot-checking. Like discovering that OnPositionUpdated — which you thought was a "sometimes" event — actually fires 60 times per second with 20 listeners. That's 1,200 listener executions per second. Even at 0.01ms each, that's 12ms per second of CPU time for one event. On mobile, that matters.
Or discovering that OnBossDied has zero raises after a full playthrough that includes boss fights. Either the event isn't wired correctly, or it's dead code. Either way, you want to know.
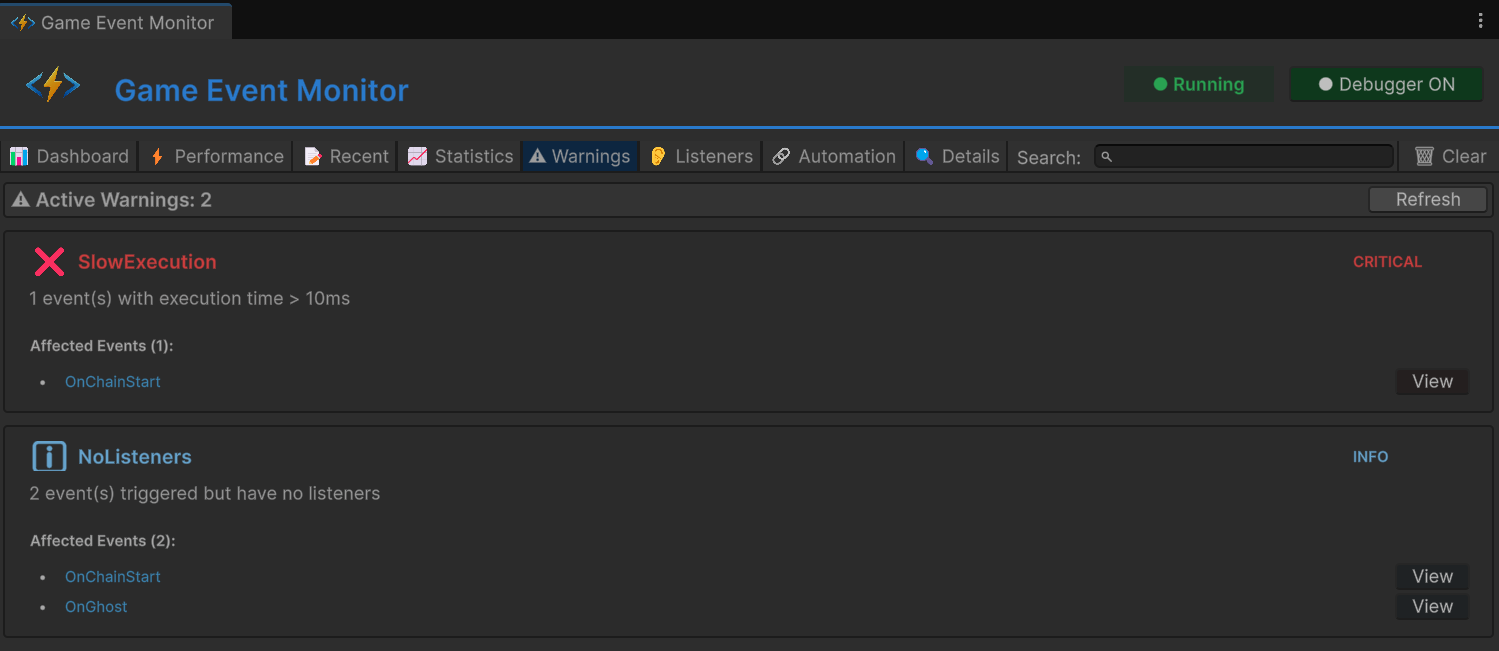
Tab 5: Warnings — The Automatic Health Check
The Warnings tab watches your event system and flags problems automatically. You don't have to know what to look for — it knows.
Performance warnings:
- Event with execution time > 10ms (Red)
- Event with execution time > 5ms (Yellow)
- Event raising > 100 times per second without conditional listeners (Yellow)
Listener warnings:
- Event with > 50 listeners (Yellow)
- Event with > 100 listeners (Red)
- Persistent listener on a non-DontDestroyOnLoad object (Yellow)
Memory warnings:
- Event raise causing GC allocation (Yellow)
- High-frequency event with GC allocation (Red)
Recursion warnings:
- Event raised while already being processed (Red)
- Circular trigger/chain dependency detected (Red)
Each warning includes the event name, the specific metric that triggered it, and a suggested action. Not just "this is bad" but "consider adding conditional listeners to reduce execution count" or "check for missing RemoveListener calls."
The recursion detection alone is worth the price of admission. Event A raises B raises A raises B... is one of the nastiest bugs in event-driven systems. Without automatic detection, you discover it when the game freezes and the stack overflows. The Warnings tab catches it the instant it happens and tells you exactly which events are involved.
Tab 6: Listeners — The Subscription Map
This tab shows every active listener subscription, organized by event and listener type.
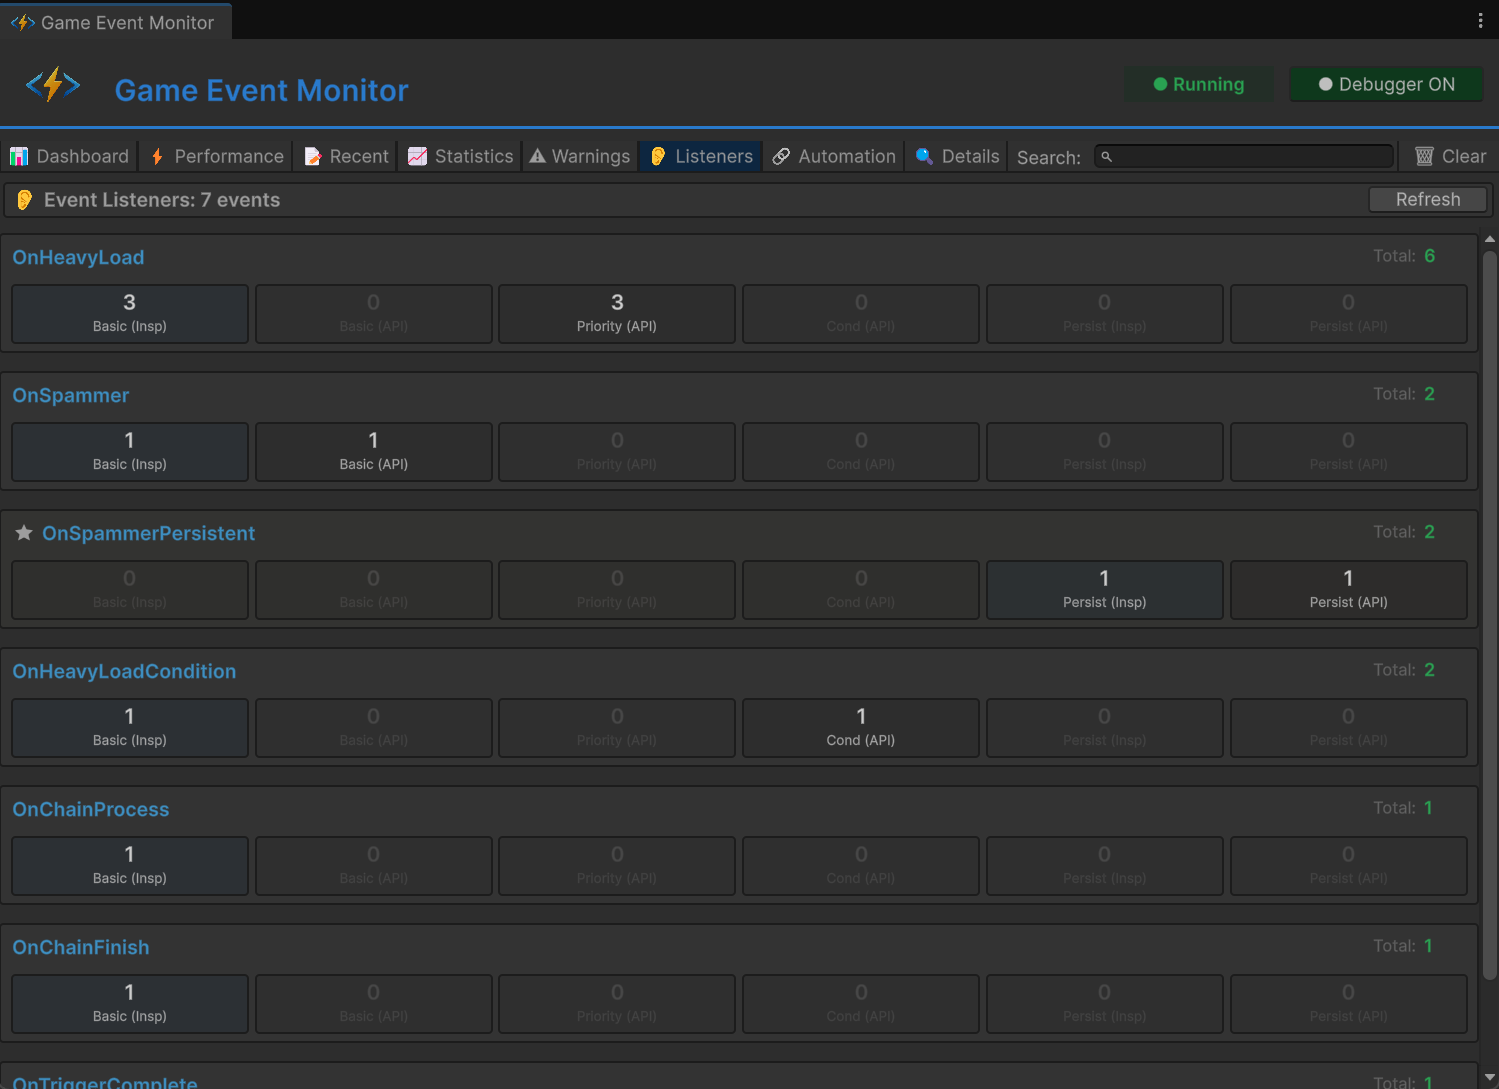
Expand any event to see its listeners grouped by layer:
OnPlayerDamaged (12 listeners)
+-- Basic (4)
|   +-- HealthSystem.HandleDamage
|   +-- HitFlash.ShowFlash
|   +-- CameraShake.OnDamage
|   +-- SoundManager.PlayHitSound
+-- Priority (3)
|   +-- [200] ArmorSystem.ReduceDamage
|   +-- [100] HealthSystem.ApplyDamage
|   +-- [25]  HealthUI.RefreshBar
+-- Conditional (2)
|   +-- [cond] BossModifier.ApplyBossMultiplier
|   +-- [cond] CriticalHit.CheckCritical
+-- Persistent (1)
|   +-- AnalyticsManager.TrackDamage
+-- Triggers (1)
|   +-- -> OnScreenShake (delay: 0s)
+-- Chains (1)
    +-- -> OnDamageNumber (delay: 0.1s, duration: 0.5s)
Subscription audit: verify that expected listeners are actually subscribed. "Why isn't the hit sound playing?" Check here — is SoundManager.PlayHitSound listed? If not, the subscription is missing (probably a lifecycle issue — the object was destroyed and recreated without re-subscribing).
Priority verification: confirm execution order makes sense. If the UI update (priority 25) is processing before the data mutation (priority 100), your priority values are inverted.
Leak detection: if a listener appears for an object that should have been destroyed, you've found a subscription leak. The listener's target is stale, and you're missing a RemoveListener call in OnDisable or OnDestroy.
Tab 7: Automation — The Flow Map
This tab visualizes event-to-event connections — triggers and chains — as a dependency graph.
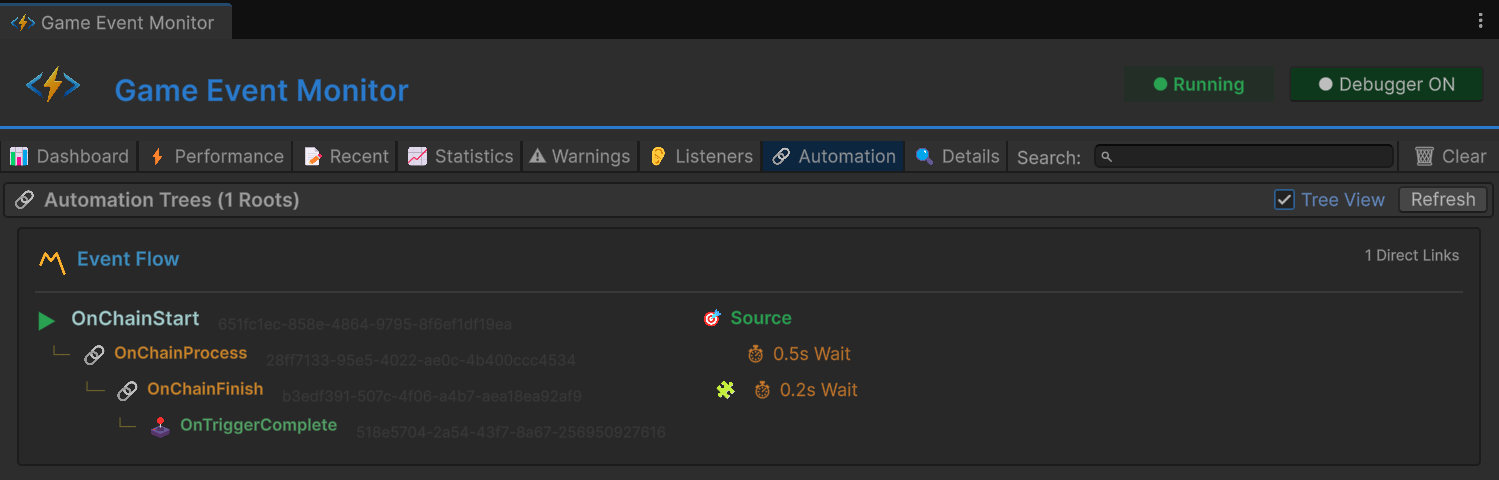
The tree view shows each event as a root with outgoing connections as children:
OnBossDefeated
+-- [trigger] -> OnPlayVictoryMusic (delay: 0s)
+-- [trigger] -> OnShowVictoryUI (delay: 1s)
+-- [chain] -> OnSaveProgress (delay: 2s)
    +-- [chain] -> OnLoadNextLevel (delay: 0.5s)
Great for answering "when the boss dies, what else happens?" Follow the tree and see the full propagation path.
Both views show connections configured visually in the Node Editor (marked "visual") and connections created programmatically at runtime (marked "runtime"). If a flow isn't working, check whether the expected connection exists at all. If it shows "visual" but not "runtime," the configuration is correct but something is preventing runtime initialization.
Tab 8: Details — The Deep Dive
Click any event in any other tab and the Details tab opens a comprehensive view of that single event.
Total raises, avg/min/max execution time, current listener count by type, GC allocation per raise, frequency over the last 60 seconds, last raise timestamp and argument. Everything you need to understand one event's behavior at a glance.
The critical addition: per-listener breakdown. While the Performance tab shows aggregate per-event times, the Details tab shows per-listener times within a single event.
If OnPlayerDamaged averages 3ms with 10 listeners, the Details tab tells you that ArmorSystem.ReduceDamage takes 2.5ms and the other 9 listeners take 0.05ms each. Now you know exactly where to optimize. No guessing, no adding Stopwatch instrumentation to every handler, no Debug.Log timing code.
The listener history section shows additions and removals over time:
[0.0s]  + AddListener: HealthSystem.HandleDamage
[0.0s]  + AddPriorityListener: ArmorSystem.ReduceDamage (200)
[15.3s] - RemoveListener: HealthSystem.HandleDamage
[15.3s] + AddListener: HealthSystem.HandleDamage
[45.0s] + AddConditionalListener: BossModifier.Apply (100)
This helps debug "phantom listener" issues — listeners that appear and disappear due to object lifecycle events (scene loads, object pooling, enable/disable cycles).
The Complete Debugging Workflow
Let me revisit that door bug from the intro. With both tools, here's how the investigation goes:
Step 1: Reproduce. Pick up key after save/load. Door doesn't open.
Step 2: Check Recent Events. Open the Runtime Monitor's Recent tab, filter for OnKeyPickedUp. Is it there? Yes — it fired at timestamp 23.4s with the correct key ID. The raise is fine. Problem is downstream.
Step 3: Check Listeners. Switch to the Listeners tab, find OnKeyPickedUp. Is the door's listener subscribed? No — it's missing. It was there before the save/load, but it's gone now.
Step 4: Identify Root Cause. The door's listener registers in OnEnable. After loading, the door object was destroyed and recreated, but OnEnable ran before the event database finished loading. The listener tried to subscribe to a null event reference.
Step 5: Verify the Fix. After fixing the initialization order, use Event Finder to scan OnKeyPickedUp and confirm the door's reference is Green (valid). Play through the save/load cycle again. Check Recent Events — the event fires. Check Listeners — the door is subscribed. Door opens. Bug fixed.
Total investigation time: about 90 seconds. No Debug.Log. No guessing. No "works on my machine."
Edit-Time + Play-Time = Full Coverage
The Event Finder and Runtime Monitor complement each other perfectly because they cover different phases of development:
| Tool | Phase | Questions It Answers |
|---|---|---|
| Event Finder | Edit-time | "Who references this event?" "Is it safe to rename/delete?" "Are all bindings valid?" |
| Monitor Dashboard | Play-time | "Is my event system healthy right now?" |
| Monitor Performance | Play-time | "Which events are slow and why?" |
| Monitor Recent | Play-time | "What just happened, in what order?" |
| Monitor Statistics | Play-time | "What are the long-term usage patterns?" |
| Monitor Warnings | Play-time | "What should I worry about?" |
| Monitor Listeners | Play-time | "Who is listening to what, right now?" |
| Monitor Automation | Play-time | "How are events connected to each other?" |
| Monitor Details | Play-time | "Tell me everything about this one event." |
The Event Finder gives you confidence to refactor. The Runtime Monitor gives you confidence that your running game is behaving correctly. Together, they close the observability gap that makes event-driven architecture so frustrating to debug.
Event-driven architecture is powerful. But power without visibility is just a fancier way to create bugs you can't find. These tools give you the visibility. Keep the Dashboard open during development. Run Event Finder before any refactoring session. When something feels off, you'll know exactly which tab to check — and the answer will be waiting for you, not buried in 500 lines of Debug.Log output.
🚀 Global Developer Service Matrix
🇨🇳 China Developer Community
- 🛒 Unity China Asset Store
- 🎥 Bilibili Video Tutorials
- 📘 Technical Documentation
- 💬 QQ Group (1071507578)
🌐 Global Developer Community
📧 Support & Collaboration