14 Runtime Monitor: Production Observability
Stress-test the event system with four test units and read every Monitor tab: performance timings, firing frequency, listener counts, graph structure, and integrity warnings.
For developers profiling event performance and diagnosing frame drops, spam, or missing listeners.Overview
In production, events fire thousands of times per second. Debug.Log() creates garbage, floods the console, and gives no structured view of system health. The Game Event Monitor provides real-time performance profiling, listener tracking, frequency analysis, and integrity warnings.
The Game Event Monitor is a specialized debugging window that answers critical questions:
- "Which event is causing that frame drop?"
- "Is this event firing too often?"
- "Who is actually listening to this event right now?"
- "Why did my chain sequence break?"
This demo simulates a high-load stress test facility with four specialized test units, each designed to populate specific Monitor tabs with diagnostic data.
- How to open and navigate the Runtime Monitor window
- Reading performance metrics (avg/min/max execution time)
- Analyzing event frequency and detecting spam
- Inspecting listener counts (Inspector vs API bindings)
- Visualizing programmatic Flow Graphs
- Detecting integrity issues (ghost events, broken chains)
- Interpreting warnings and health indicators
Demo Scene
Assets/TinyGiants/GameEventSystem/Demo/14_RuntimeMonitor/14_RuntimeMonitor.unity
Scene Composition
Visual Elements:
- 🎯 Test Console - Information panel describing 4 test units
- 🧊 Simple Geometry - Plane and Cube (minimal scene)
UI Layer (Canvas):
- 🎮 Four Control Buttons - Bottom of screen
- "Toggle Spammer (Unit A)" → Starts/stops high-frequency spam
- "Trigger Heavy Load (Unit B)" → Fires expensive operation
- "Fire Chain Reaction (Unit C)" → Executes programmatic chain
- "Fire Ghost Event (Unit D)" → Raises event with no listeners
Game Logic Layer:
- 📤 RuntimeMonitorRaiser - Test orchestrator
- 📥 RuntimeMonitorReceiver - Test responder with instrumented listeners
The 4 Test Units
Each unit is designed to stress-test a specific Monitor subsystem:
Unit A: The Spammer (Frequency Test)
Purpose: Generate high-frequency event spam to test Statistics tab
Configuration:
- Events:
OnSpammer(void),OnSpammerPersistent(void) - Behavior: Fires >60 times/second in
Update()while active - Monitor Goal: Detect high-frequency warnings
Expected Results:
- 📈 Statistics Tab: Shows >60 fires/sec (RED warning)
- ⚠️ Warnings Tab: Flags
[High Frequency]issue
Unit B: The Heavy Lifter (Performance Test)
Purpose: Simulate expensive computation to test Performance tab
Configuration:
- Events:
OnHeavyLoad,OnHeavyLoadCondition(GameObject, DamageInfo) - Behavior: Listener calls
Thread.Sleep(6)to simulate 6ms+ lag - Monitor Goal: Trigger performance warnings
Expected Results:
- ⚡ Performance Tab: Execution time shows 6-12ms (YELLOW/RED)
- 📊 Dashboard: Performance bar turns yellow/red
Code Mechanism:
public void OnHeavyExecution(GameObject sender, DamageInfo info)
{
    // Simulate heavy computation (BAD in production, perfect for testing!)
    Thread.Sleep(6);  // ← Forces 6ms execution time
}
Unit C: The Chain Reactor (Automation Test)
Purpose: Demonstrate programmatic Flow Graph visualization
Configuration:
- Events:
OnChainStart→OnChainProcess→OnChainFinish→OnTriggerComplete - Behavior: Code-built sequential pipeline with delays and conditions
- Monitor Goal: Visualize dynamic automation in Automation tab
Graph Structure:
🚀 [ START ] OnChainStart (DamageInfo)
│   ➔ Payload: { amount: 75.0, type: Physical, ... }
│
├─ ⏱️ [ STEP 1 ] ➔ Delay: 0.5s
│  └─► ⚙️ OnChainProcess (DamageInfo)      ✅ Data Relayed
│
├─ ⚖️ [ STEP 2 ] ➔ Delay: 0.2s | Guard: `amount > 50`
│  └─► 🎯 OnChainFinish (DamageInfo)       ✅ Logic Passed (75 > 50)
│
└─ 🧹 [ STEP 3 ] ➔ Trigger Mode | Block Args
   └─► 🏁 OnTriggerComplete (void)        ✅ Signal Purified
│
📊 Result: Pipeline Completed | 🛡️ Data Safety: Argument Blocked at Exit
Expected Results:
- 🔗 Automation Tab: Shows hierarchical tree with timing/condition badges
- 📝 Recent Events Tab: Sequential firing pattern visible
Unit D: The Ghost (Integrity Test)
Purpose: Detect events fired with no listeners
Configuration:
- Event:
OnGhost(void) - Behavior: Raises event with zero listeners bound
- Monitor Goal: Trigger integrity warning
Expected Results:
- ⚠️ Warnings Tab: Shows
[No Listeners]warning - 📊 Dashboard: Warning count increases
How to Test (Step-by-Step)
Phase 1: Preparation
Step 1: Open Monitor Window
-
Menu
The utility is located within the Game Event System, you can access through the following method:
From the System Dashboard:
Game Event System Window → Click "Game Event Monitor" -
Window appears
dockable like any Unity Editor window
Step 2: Enter Play Mode
- Click Unity's Play button
- Monitor remains visible during play
Phase 2: Generate Test Data
Step 3: Activate Unit A (Spammer)
- Click "Toggle Spammer (Unit A)" button
- Observe: Button stays active (toggled ON)
- Effect:
OnSpammerfires >60 times/second
Step 4: Activate Unit B (Heavy Load)
- Click "Trigger Heavy Load (Unit B)" button 3-5 times
- Effect: Each click triggers one expensive operation (6ms lag)
Step 5: Activate Unit C (Chain Reaction)
- Click "Fire Chain Reaction (Unit C)" button once
- Effect: Initiates 4-step sequential pipeline
Step 6: Activate Unit D (Ghost Event)
- Click "Fire Ghost Event (Unit D)" button once
- Effect: Raises event with no listeners (integrity violation)
After triggering all units, wait 5-10 seconds to accumulate data before analyzing Monitor tabs.
Monitor Window Analysis
Tab 1: 🏠 Dashboard (System Health Overview)
The landing page—aggregates metrics from all subsystems into a single health report.
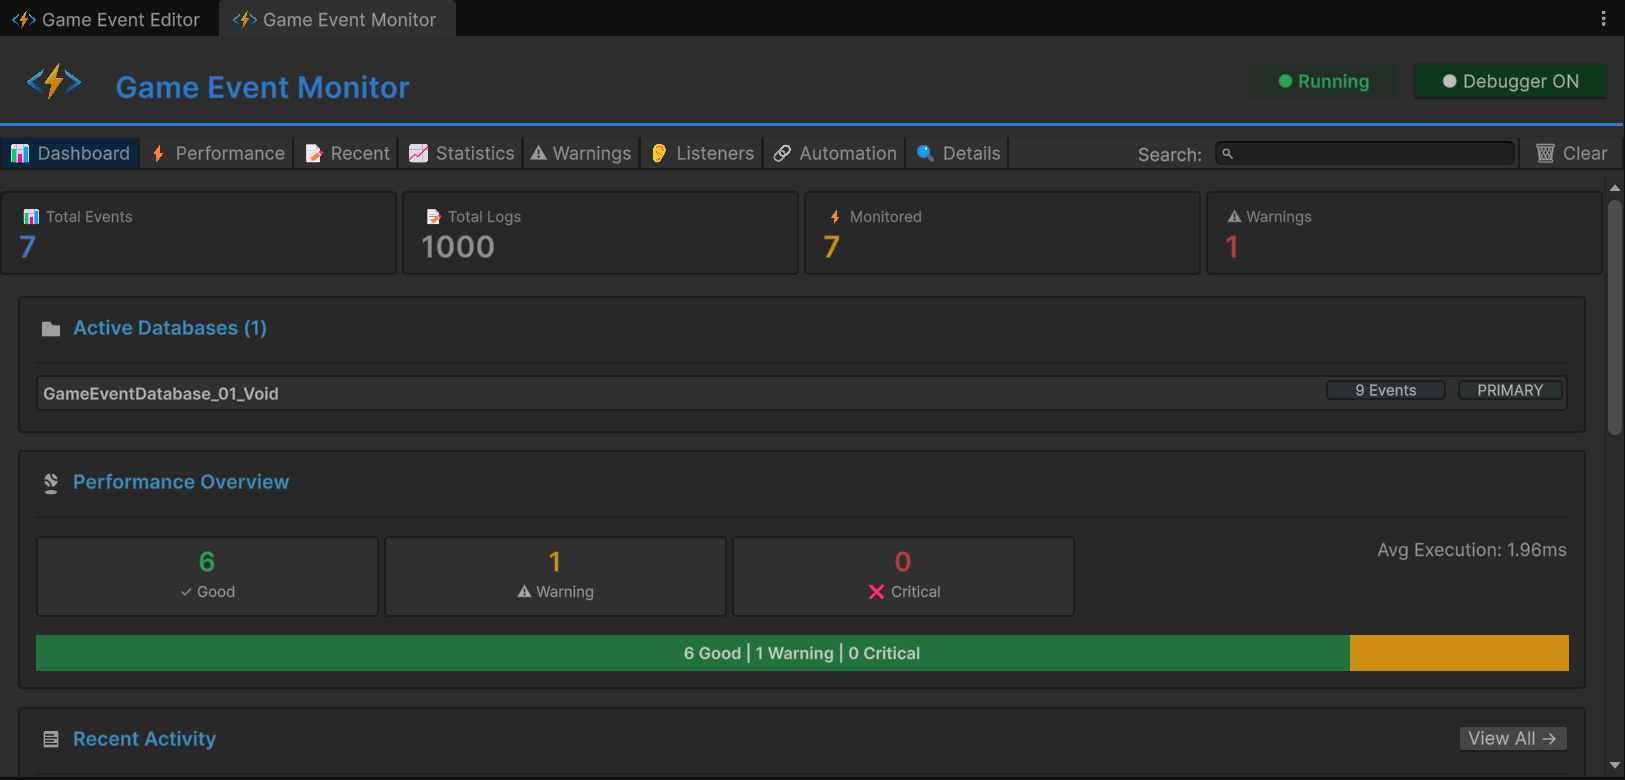
Metric Cards (Top Row):
| Card | Meaning | Expected Value |
|---|---|---|
| Total Events | Loaded event count | 9 |
| Total Logs | Cumulative fires since play start | 500+ (climbing) |
| Monitored | Events with active performance tracking | 4-6 |
| Warnings | Current active issues | 2+ (Spam + Ghost) |
Active Databases Section:
- Lists all loaded database assets
- PRIMARY badge shows main database
- Click database name to filter views
Performance Overview (Traffic Light Bar):
- 🟢 Green: All events <1ms (healthy)
- 🟡 Yellow: Some events 1-5ms (caution)
- 🔴 Red: Events >5ms detected (critical)
- Shows percentage distribution
Recent Activity (Mini-Log):
- Last 15 event firings
- Format:
[Frame] EventName (args) - Click to jump to Details tab
Quick Warnings (Top 3):
- Most critical alerts surfaced
- Severity icons: 🔵 Info, 🟡 Warning, 🔴 Critical
- Click to jump to Warnings tab
Single-glance system health check—like a car's instrument panel. If this shows red/yellow, drill into specific tabs for diagnosis.
Tab 2: ⚡ Performance (Execution Profiling)
Focus: Detect performance bottlenecks by execution time
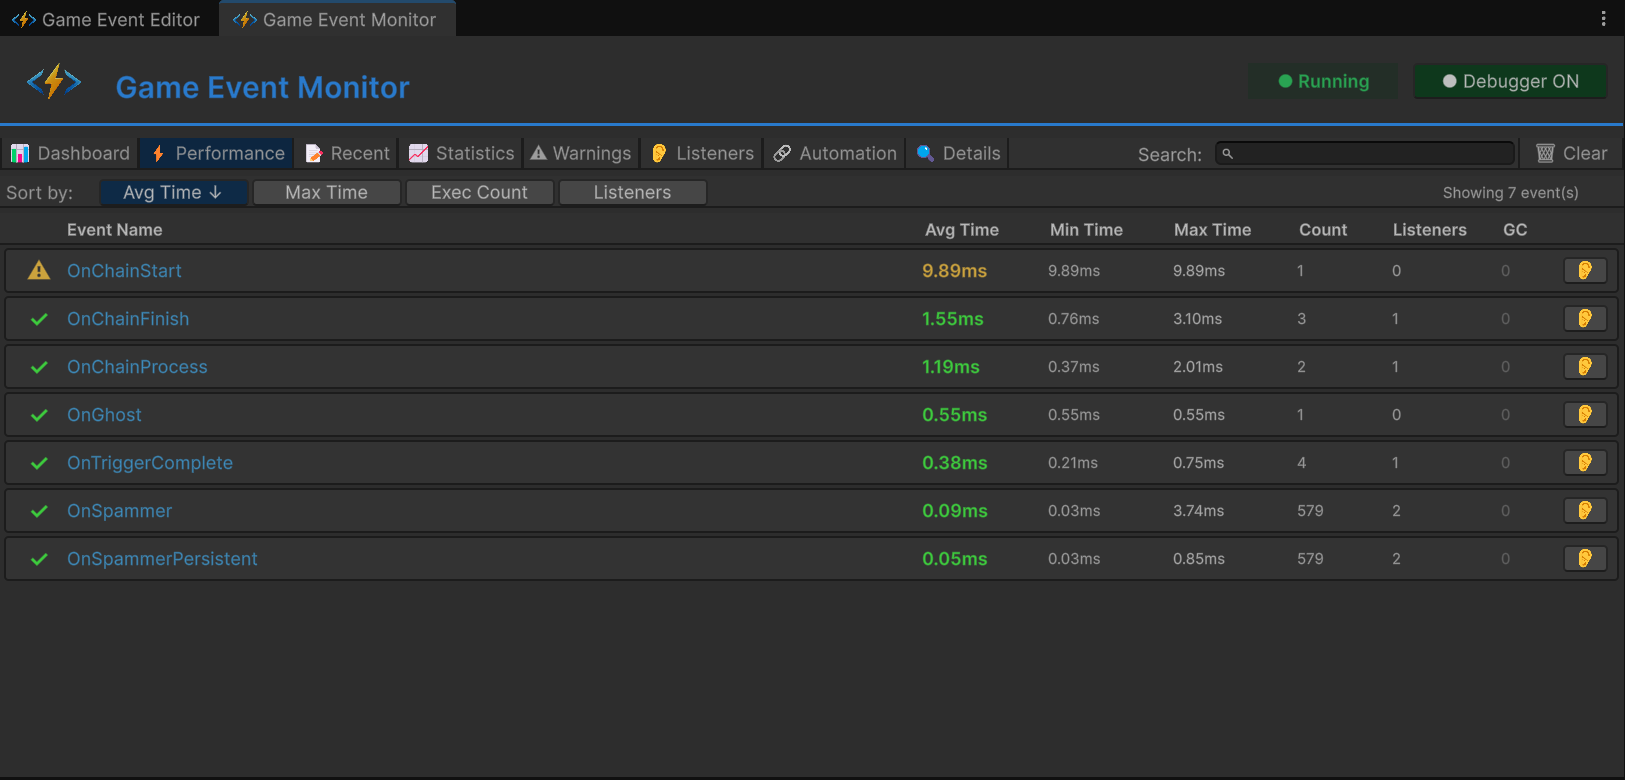
Columns:
| Column | Meaning | Healthy Range |
|---|---|---|
| Event Name | Event identifier | - |
| Avg Time | Average execution ms | <1ms 🟢 |
| Min Time | Fastest execution | - |
| Max Time | Slowest execution | <5ms 🟡, >5ms 🔴 |
| Listeners | Avg listener count per fire | - |
| GC Alloc | Garbage generated per fire | 0 KB ideal |
Color Coding:
- 🟢 Green: 0-1ms (excellent)
- 🟡 Yellow: 1-5ms (monitor)
- 🔴 Red: >5ms (investigate)
Test Results (Unit B):
- Locate
OnHeavyLoadevent in table - Avg Time: Shows ~6.00ms (🟡 Yellow)
- Max Time: May show ~12.00ms if clicked multiple times (🔴 Red)
- Cause:
Thread.Sleep(6)in listener code
Usage:
- Sort by "Avg Time" to find worst offenders
- Click event name to see Details tab
- Compare listener counts—more listeners = higher risk
General rule: Keep avg execution time <1ms. Budget total frame time (16ms @ 60fps) across all systems.
Tab 3: 📝 Recent Events (Real-Time Event Log)
Focus: Chronological stream of all event firings
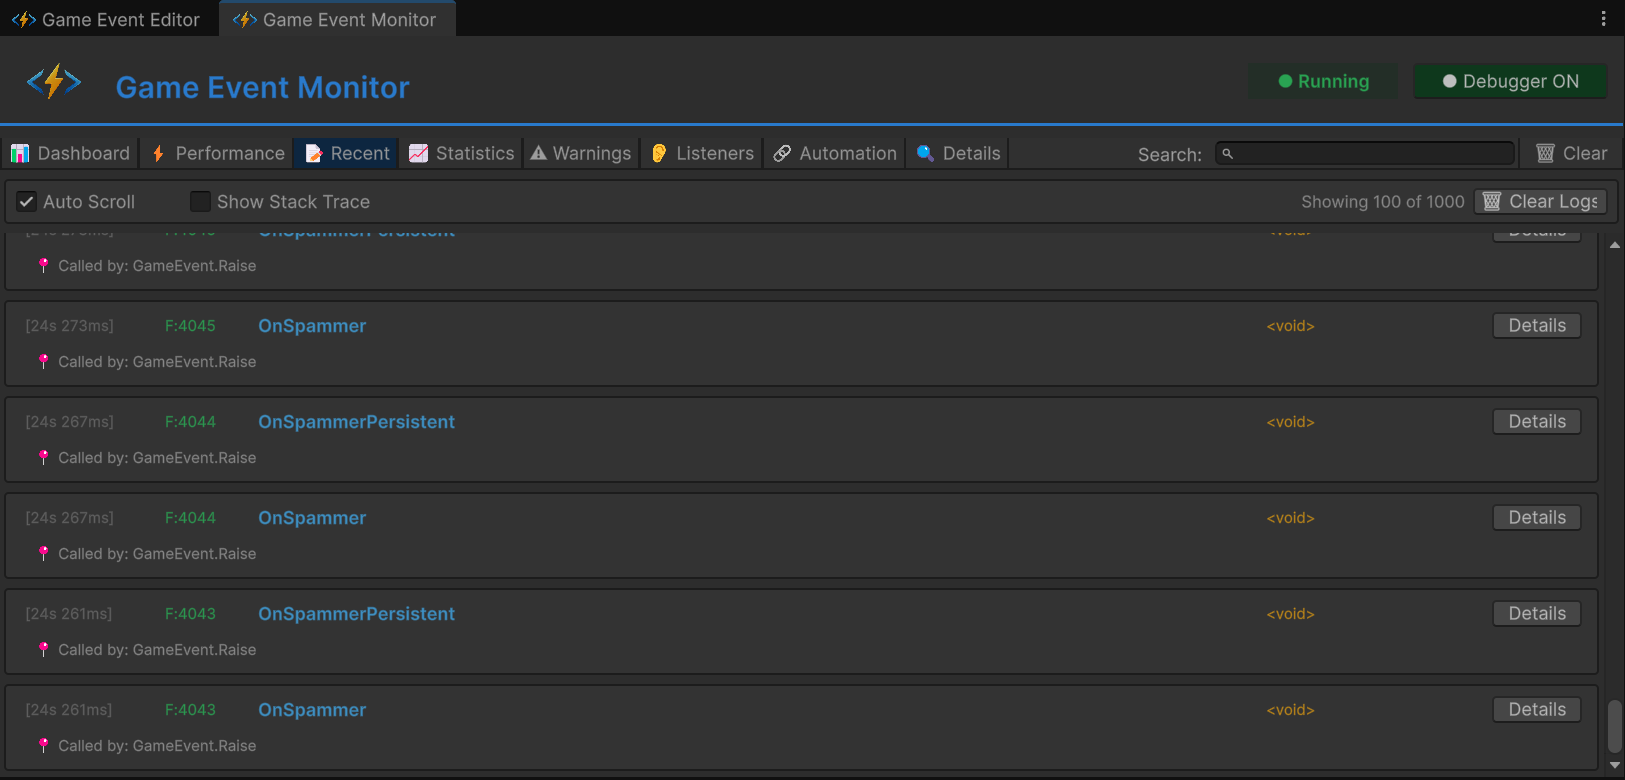
Columns:
| Column | Meaning | Example |
|---|---|---|
| Frame | Unity frame number | F:1450 |
| Time | Timestamp since play start | 12.45s |
| Event | Event name | OnHeavyLoad |
| Arguments | Payload preview | <DamageInfo: 100> |
| Caller | Method that called .Raise() | RuntimeMonitorRaiser.TriggerHeavyLoad |
Features:
- 🔍 Search: Filter by event name
- 📋 Stack Trace: Toggle to see full call stack
- 🔗 Details Link: Click event to see deep dive
Test Results (All Units):
- Unit A: Rapid succession of
OnSpammerentries (60+/sec) - Unit C: Sequential pattern:
OnChainStart→ (delay) →OnChainProcess→OnChainFinish→OnTriggerComplete - Unit D: Single
OnGhostentry
Usage:
- Verify event firing order (sequential vs parallel)
- Debug unexpected event triggers
- Investigate caller methods (who's raising this?)
Unlike Unity Console, this log is specialized for events—no noise from other Debug.Log calls, structured data preview, direct caller info.
Tab 4: 📈 Statistics (Frequency Analysis)
Focus: Long-term usage patterns and frequency tracking
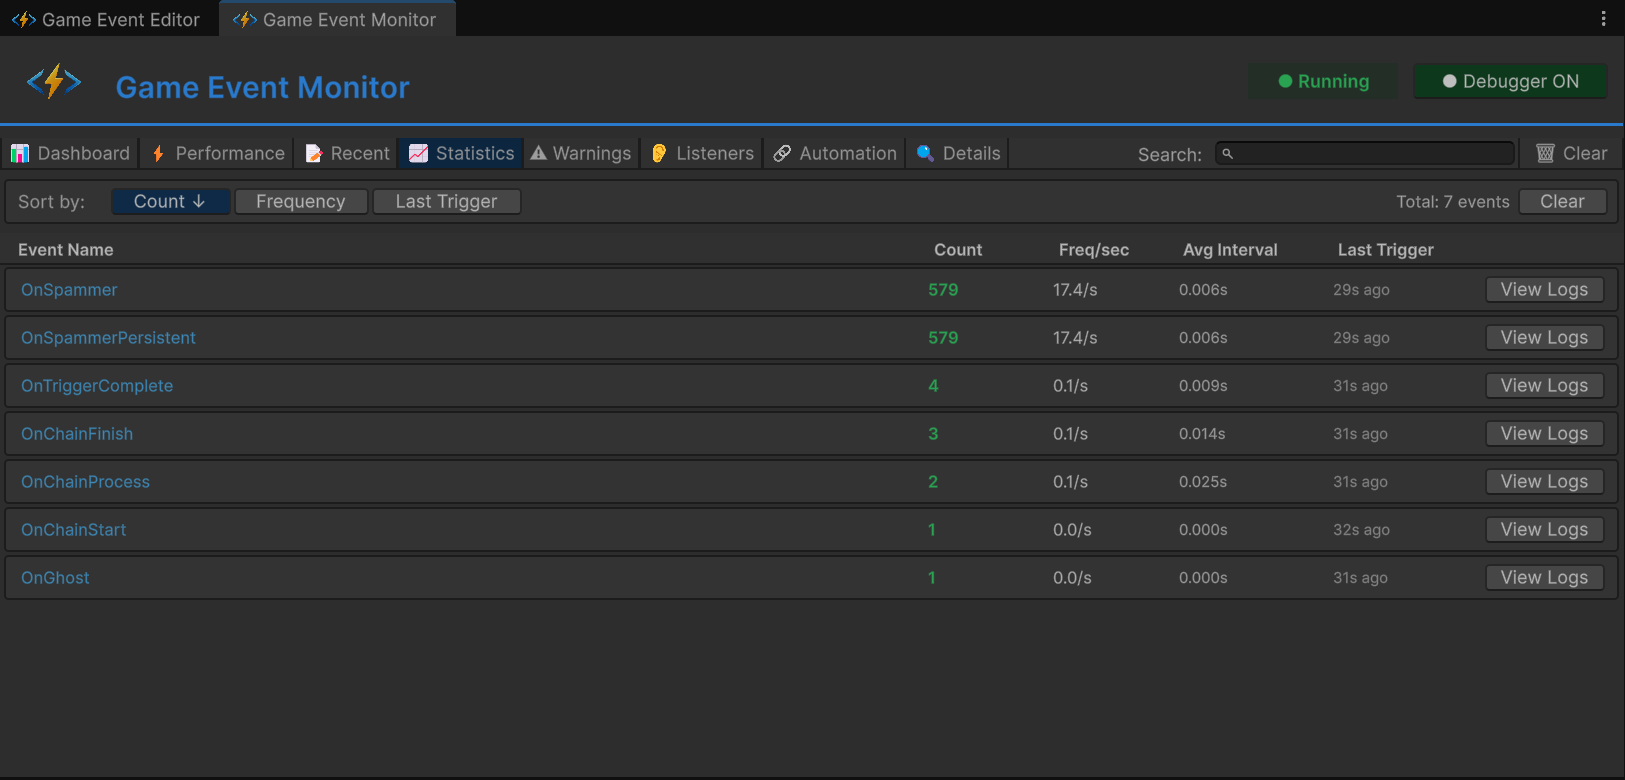
Columns:
| Column | Meaning | Healthy Range |
|---|---|---|
| Event Name | Event identifier | - |
| Trigger Count | Total fires since play start | - |
| Freq/sec | Fires per second | <10 🟢, 10-30 🟡, >30 🔴 |
| Avg Interval | Time between fires (ms) | >100ms ideal |
| Last Trigger | Time since last fire | - |
Test Results (Unit A):
- Locate
OnSpammerevent - Trigger Count: Rapidly climbing (1000+ after 10sec)
- Freq/sec: Shows >60/s (🔴 Red warning)
- Avg Interval: Shows ~16ms (every frame at 60fps)
Warning Triggers:
- 🟡 Yellow: 10-30 fires/sec
- 🔴 Red: >30 fires/sec (potential performance issue)
Usage:
- Identify event spam (too frequent)
- Detect idle events (never firing)
- Analyze firing patterns over time
- >60/sec: Likely firing every frame—consider batching
- Irregular spikes: May indicate logic bug
- Zero frequency: Dead code or misconfigured event
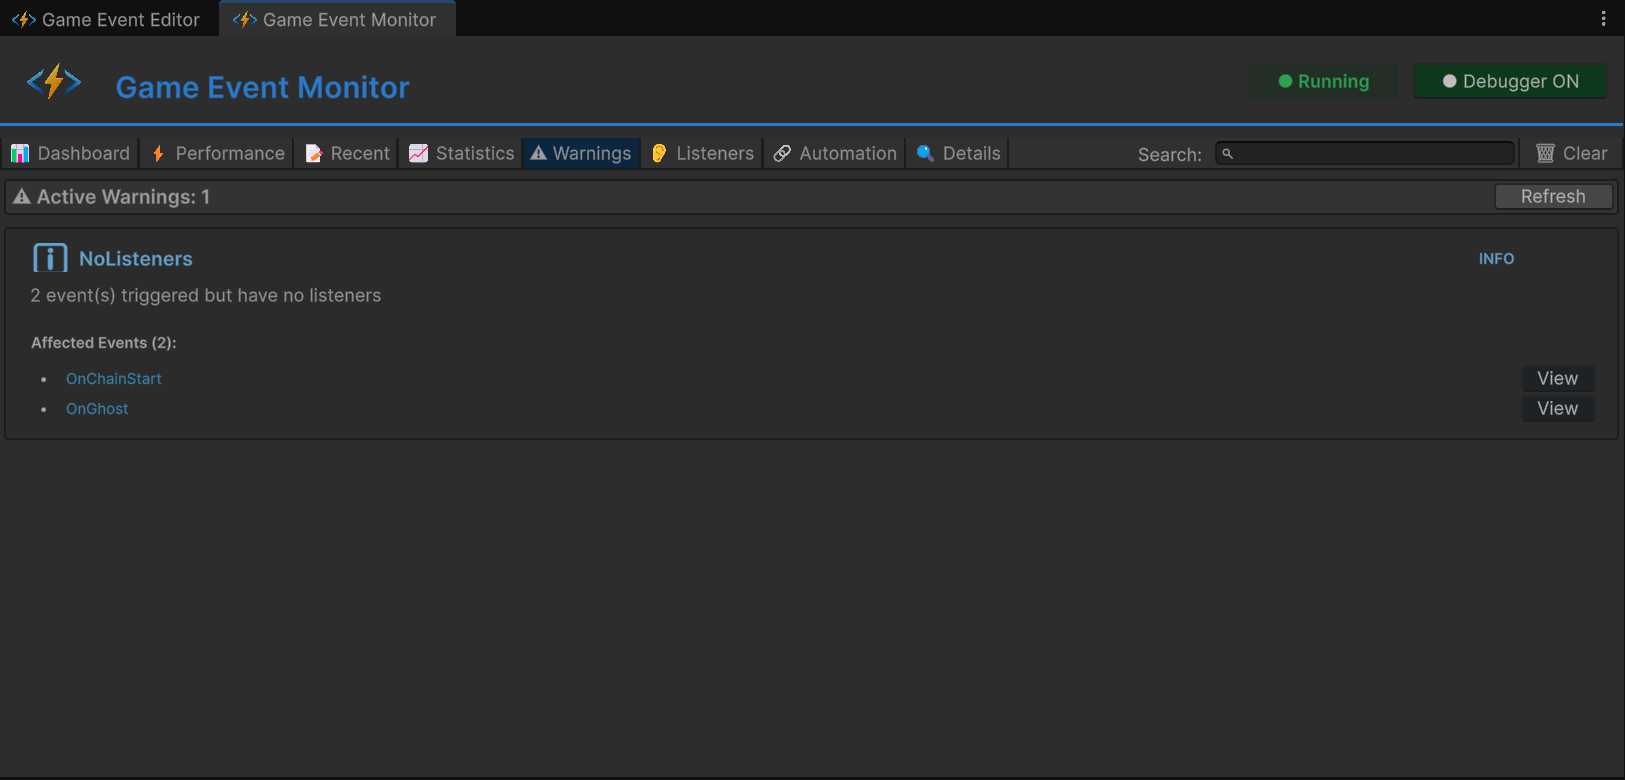
Tab 5: ⚠️ Warnings (Integrity & Health Alerts)
Focus: Filter noise, surface critical issues
Severity Levels:
| Icon | Level | Meaning |
|---|---|---|
| 🔵 | Info | Advisory notice (FYI) |
| 🟡 | Warning | Non-critical issue (monitor) |
| 🔴 | Critical | Severe problem (fix immediately) |
Warning Types:
| Warning | Trigger | Severity |
|---|---|---|
[No Listeners] | Event raised but no listeners bound | 🔵 Info |
[High Frequency] | Fires >30 times/sec | 🟡 Warning |
[Performance] | Execution time >5ms | 🔴 Critical |
[GC Pressure] | Garbage allocation >1KB/fire | 🟡 Warning |
Test Results:
- Unit A:
OnSpammer - [High Frequency] Firing at 62/sec - Unit D:
OnGhost - [No Listeners] Event raised with zero subscribers
Usage:
- Check after major feature additions
- Monitor during stress tests
- Ignore expected warnings (e.g., debug events)
[No Listeners] warnings are usually bugs—either:
- Listener registration failed (check
OnEnable) - Event asset reference is wrong
- Dead code (remove the
.Raise()call)
Tab 6: 👂 Listeners (Subscription Inspector)
Focus: Granular breakdown of WHO is listening
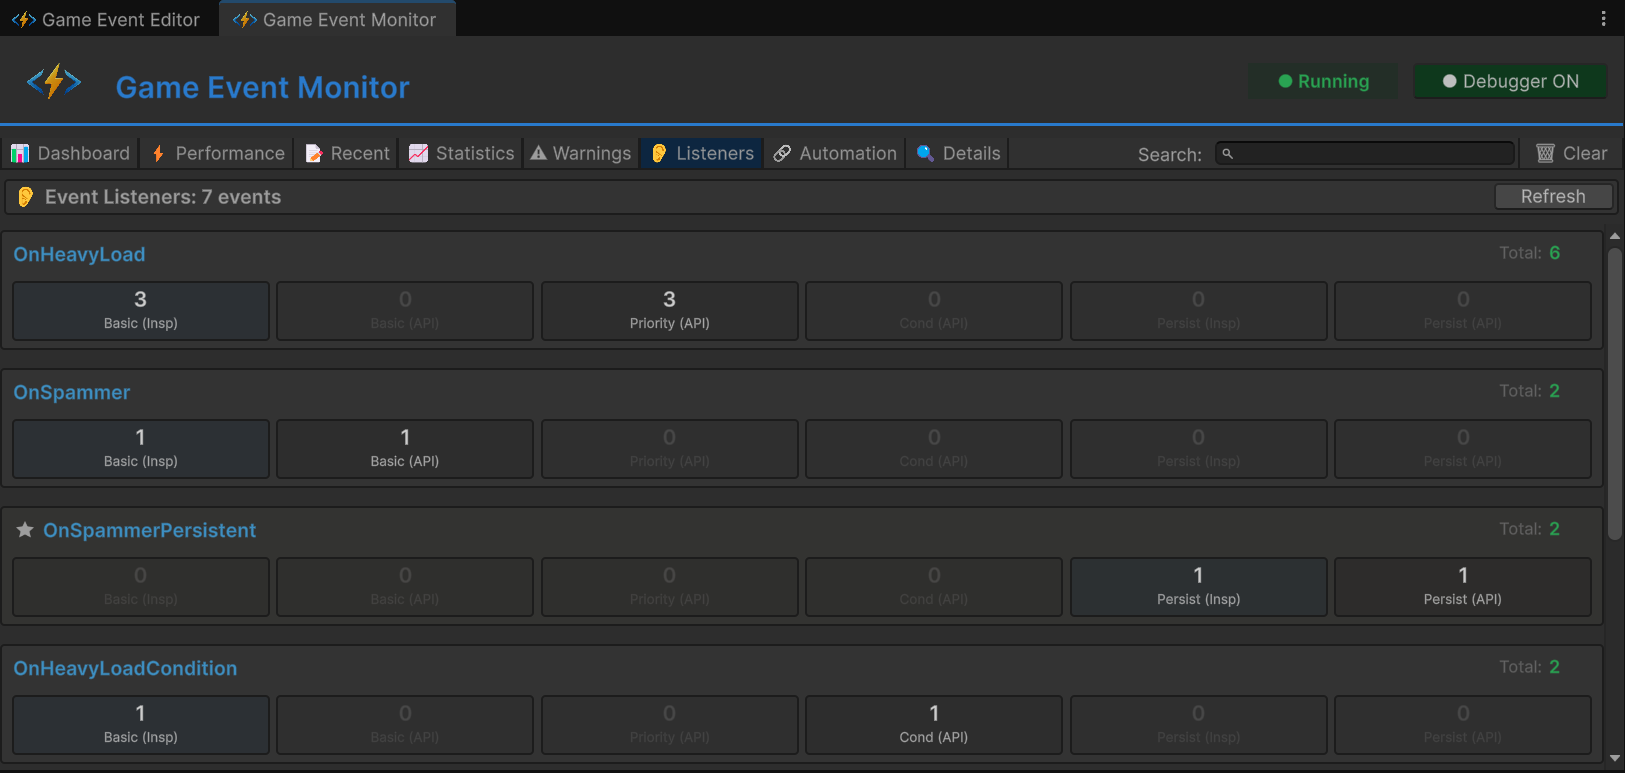
Select an event (e.g., OnHeavyLoad) to see detailed breakdown:
Listener Categories:
| Category | Meaning | Icon |
|---|---|---|
| Basic | Standard AddListener | 📌 |
| Priority | AddPriorityListener with priority value | 🔢 |
| Conditional | AddConditionalListener with predicate | ✅ |
| Persistent | AddPersistentListener (survives scenes) | 🧬 |
Breakdown Grid:
📊 Total Active Listeners: 5
│
├─ 🔗 Basic Listeners (1)
│  ├─ 📦 Inspector Bindings: 0
│  └─ 💻 API Bindings: 1
│     └─ ⚙️ RuntimeMonitorReceiver.OnHeavyExecution
│
├─ ⚖️ Priority Queue (3)
│  ├─ 🥇 High Priority (100): 1
│  │  └─ ⚙️ RuntimeMonitorReceiver.OnHeavyPreCheck
│  ├─ 🥈 Normal Priority (0): 1
│  │  └─ ⚙️ RuntimeMonitorReceiver.OnHeavyExecution
│  └─ 🥉 Low Priority (-100): 1
│     └─ ⚙️ RuntimeMonitorReceiver.OnHeavyPostCheck
│
├─ 🛡️ Conditional Guards (1)
│  └─ 💎 [Prio: 50] RuntimeMonitorReceiver.OnHeavyCriticalWarning
│     └─ 🔍 Predicate: (sender, info) => info.isCritical
│
└─ 💎 Persistent Registry (0)
   └─ (No cross-scene listeners active)
Test Results (Unit B):
- Total: 4-5 listeners
- Priority Distribution: High (1), Normal (1), Low (1)
- Conditional: 1 (with predicate preview)
Usage:
- Verify code-based registrations worked
- Check listener execution order (priority values)
- Debug missing listeners (expected vs actual count)
- Audit persistent listeners (memory leak prevention)
- Inspector Bindings: Configured in Behavior window
- API Bindings: Registered via
AddListenerin code - Both show up here—validates your hybrid approach
Tab 7: 🔗 Automation (Programmatic Flow Visualization)
Focus: Visualize code-built Trigger/Chain graphs
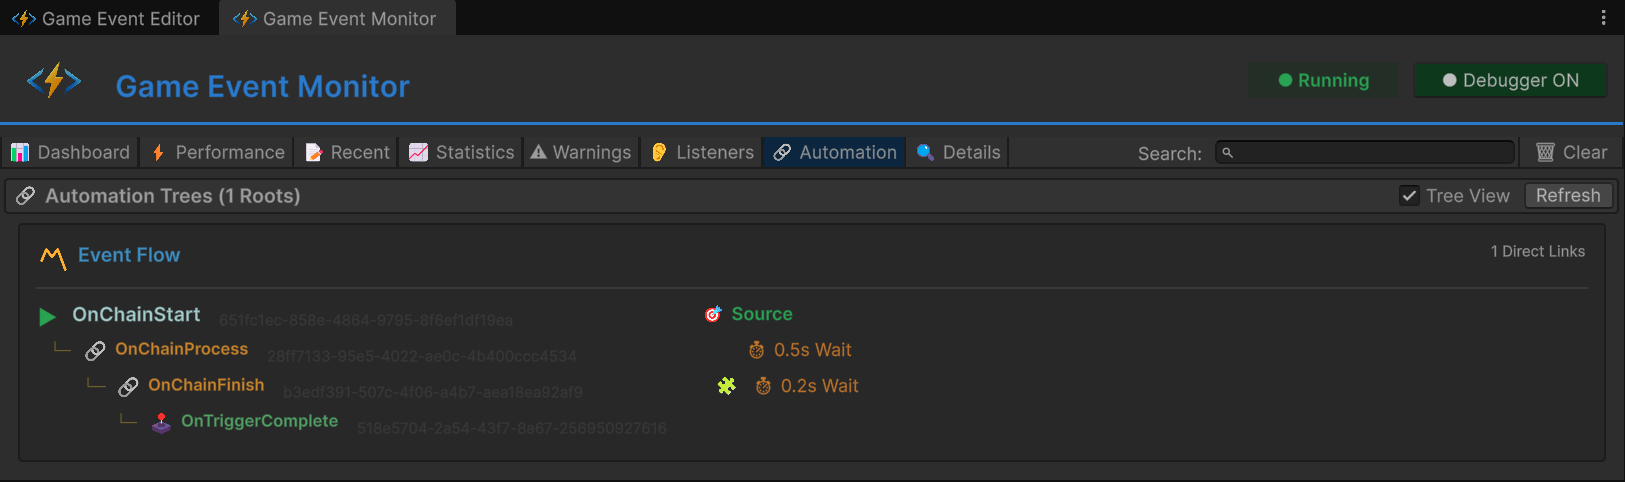
Tree View Structure:
▼ OnChainStart (Root, <DamageInfo>)
  │
  ├─ 🔗 Chain → OnChainProcess
  │   ├─ ⏱️ Delay: 0.5s
  │   ├─ ✅ Pass Argument
  │   └─ Type: <DamageInfo>
  │
  └─ (OnChainProcess expanded)
      │
      ├─ 🔗 Chain → OnChainFinish
      │   ├─ ⏱️ Delay: 0.2s
      │   ├─ 🧩 Condition: info.amount > 50
      │   ├─ ✅ Pass Argument
      │   └─ Type: <DamageInfo>
      │
      └─ (OnChainFinish expanded)
          │
          └─ 🕹️ Trigger → OnTriggerComplete
              ├─ ❌ Block Argument
              └─ Type: (void)
Badge Legend:
| Badge | Meaning |
|---|---|
⏱️ 0.5s | Delay configured |
| 🧩 | Condition enabled |
| ✅ | Argument passing enabled |
| ❌ | Argument blocked |
| 🔗 | Chain node (sequential) |
| 🕹️ | Trigger node (parallel) |
Test Results (Unit C):
- Root:
OnChainStart - Depth: 3 levels (Start → Process → Finish → Complete)
- Mixed Types: Chain (sequential) + Trigger (parallel) combined
Usage:
- Verify programmatic graphs built correctly
- Debug broken chains (missing nodes)
- Visualize complex automation without opening Flow Graph window
- Compare code-built vs visual-built graphs
- This tab: Shows code-built graphs (
AddChainEvent,AddTriggerEvent) - Flow Graph window: Shows visual-built graphs (created via UI)
- Both are valid, both are debuggable
Tab 8: 🔍 Event Details (Deep Dive)
Focus: Single-event analysis and history
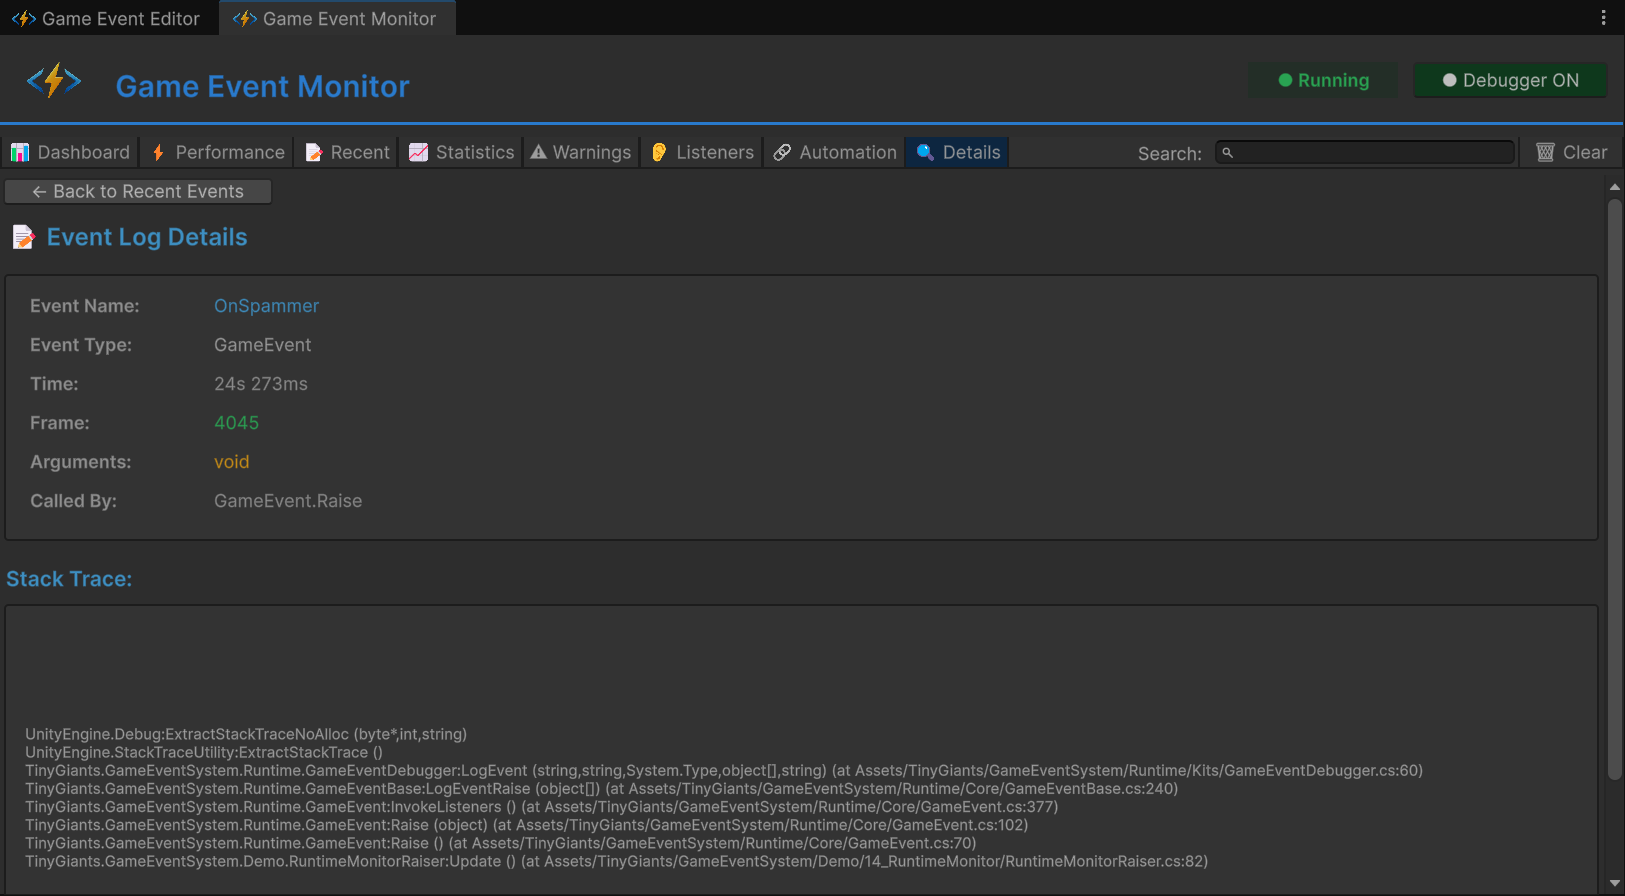
Click "Details" or "View" from any other tab to drill down.
Sections:
1. Metadata:
- GUID: Unique identifier (immutable)
- Type: Full generic signature
- Category: Organizational tag
- Database: Source asset file
2. Performance Summary:
- Avg/Min/Max Time: Same as Performance tab
- GC Allocation: Memory profile
- Listener Count: Current subscribers
3. Frequency Summary:
- Total Fires: Since play start
- Fires/Sec: Current rate
- Avg Interval: Between fires
- Last Fire: Time ago
4. Recent Activity (Filtered):
- Event-specific log stream
- Only shows this event's history
- Full stack traces available
5. Automation (If Applicable):
- Shows this event's place in Flow Graph
- Upstream/downstream connections
Usage:
- Comprehensive single-event analysis
- Compare before/after optimization
- Export data for team review
Scene Architecture
Event Organization
Events organized by test unit in Game Event Editor:
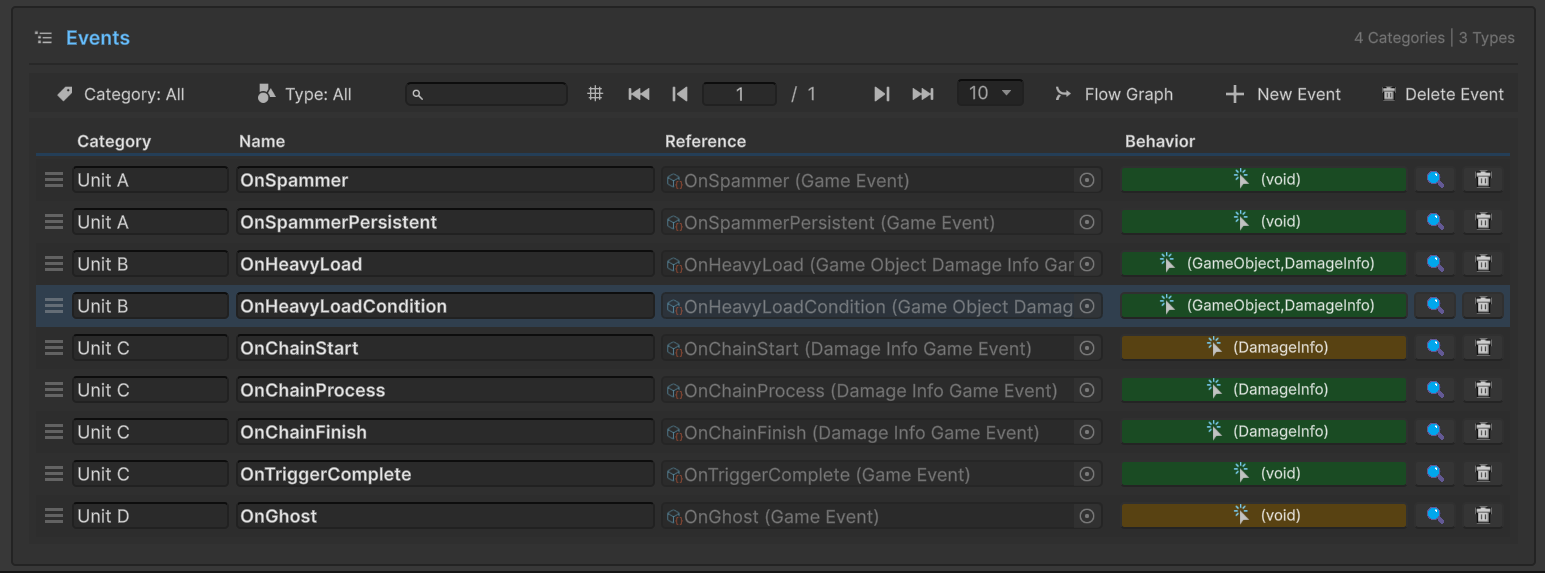
| Category | Event Name | Type | Purpose |
|---|---|---|---|
| Unit A | OnSpammer | GameEvent | High-frequency spam |
| Unit A | OnSpammerPersistent | GameEvent | Persistent spam |
| Unit B | OnHeavyLoad | GameObjectDamageInfoGameEvent | Performance test |
| Unit B | OnHeavyLoadCondition | GameObjectDamageInfoGameEvent | Conditional test |
| Unit C | OnChainStart | DamageInfoGameEvent | Root (gold) |
| Unit C | OnChainProcess | DamageInfoGameEvent | Chain step 1 |
| Unit C | OnChainFinish | DamageInfoGameEvent | Chain step 2 |
| Unit C | OnTriggerComplete | GameEvent | Chain step 3 (trigger) |
| Unit D | OnGhost | GameEvent | Integrity test |
Flow Graph Configuration
Programmatic chain built in code:
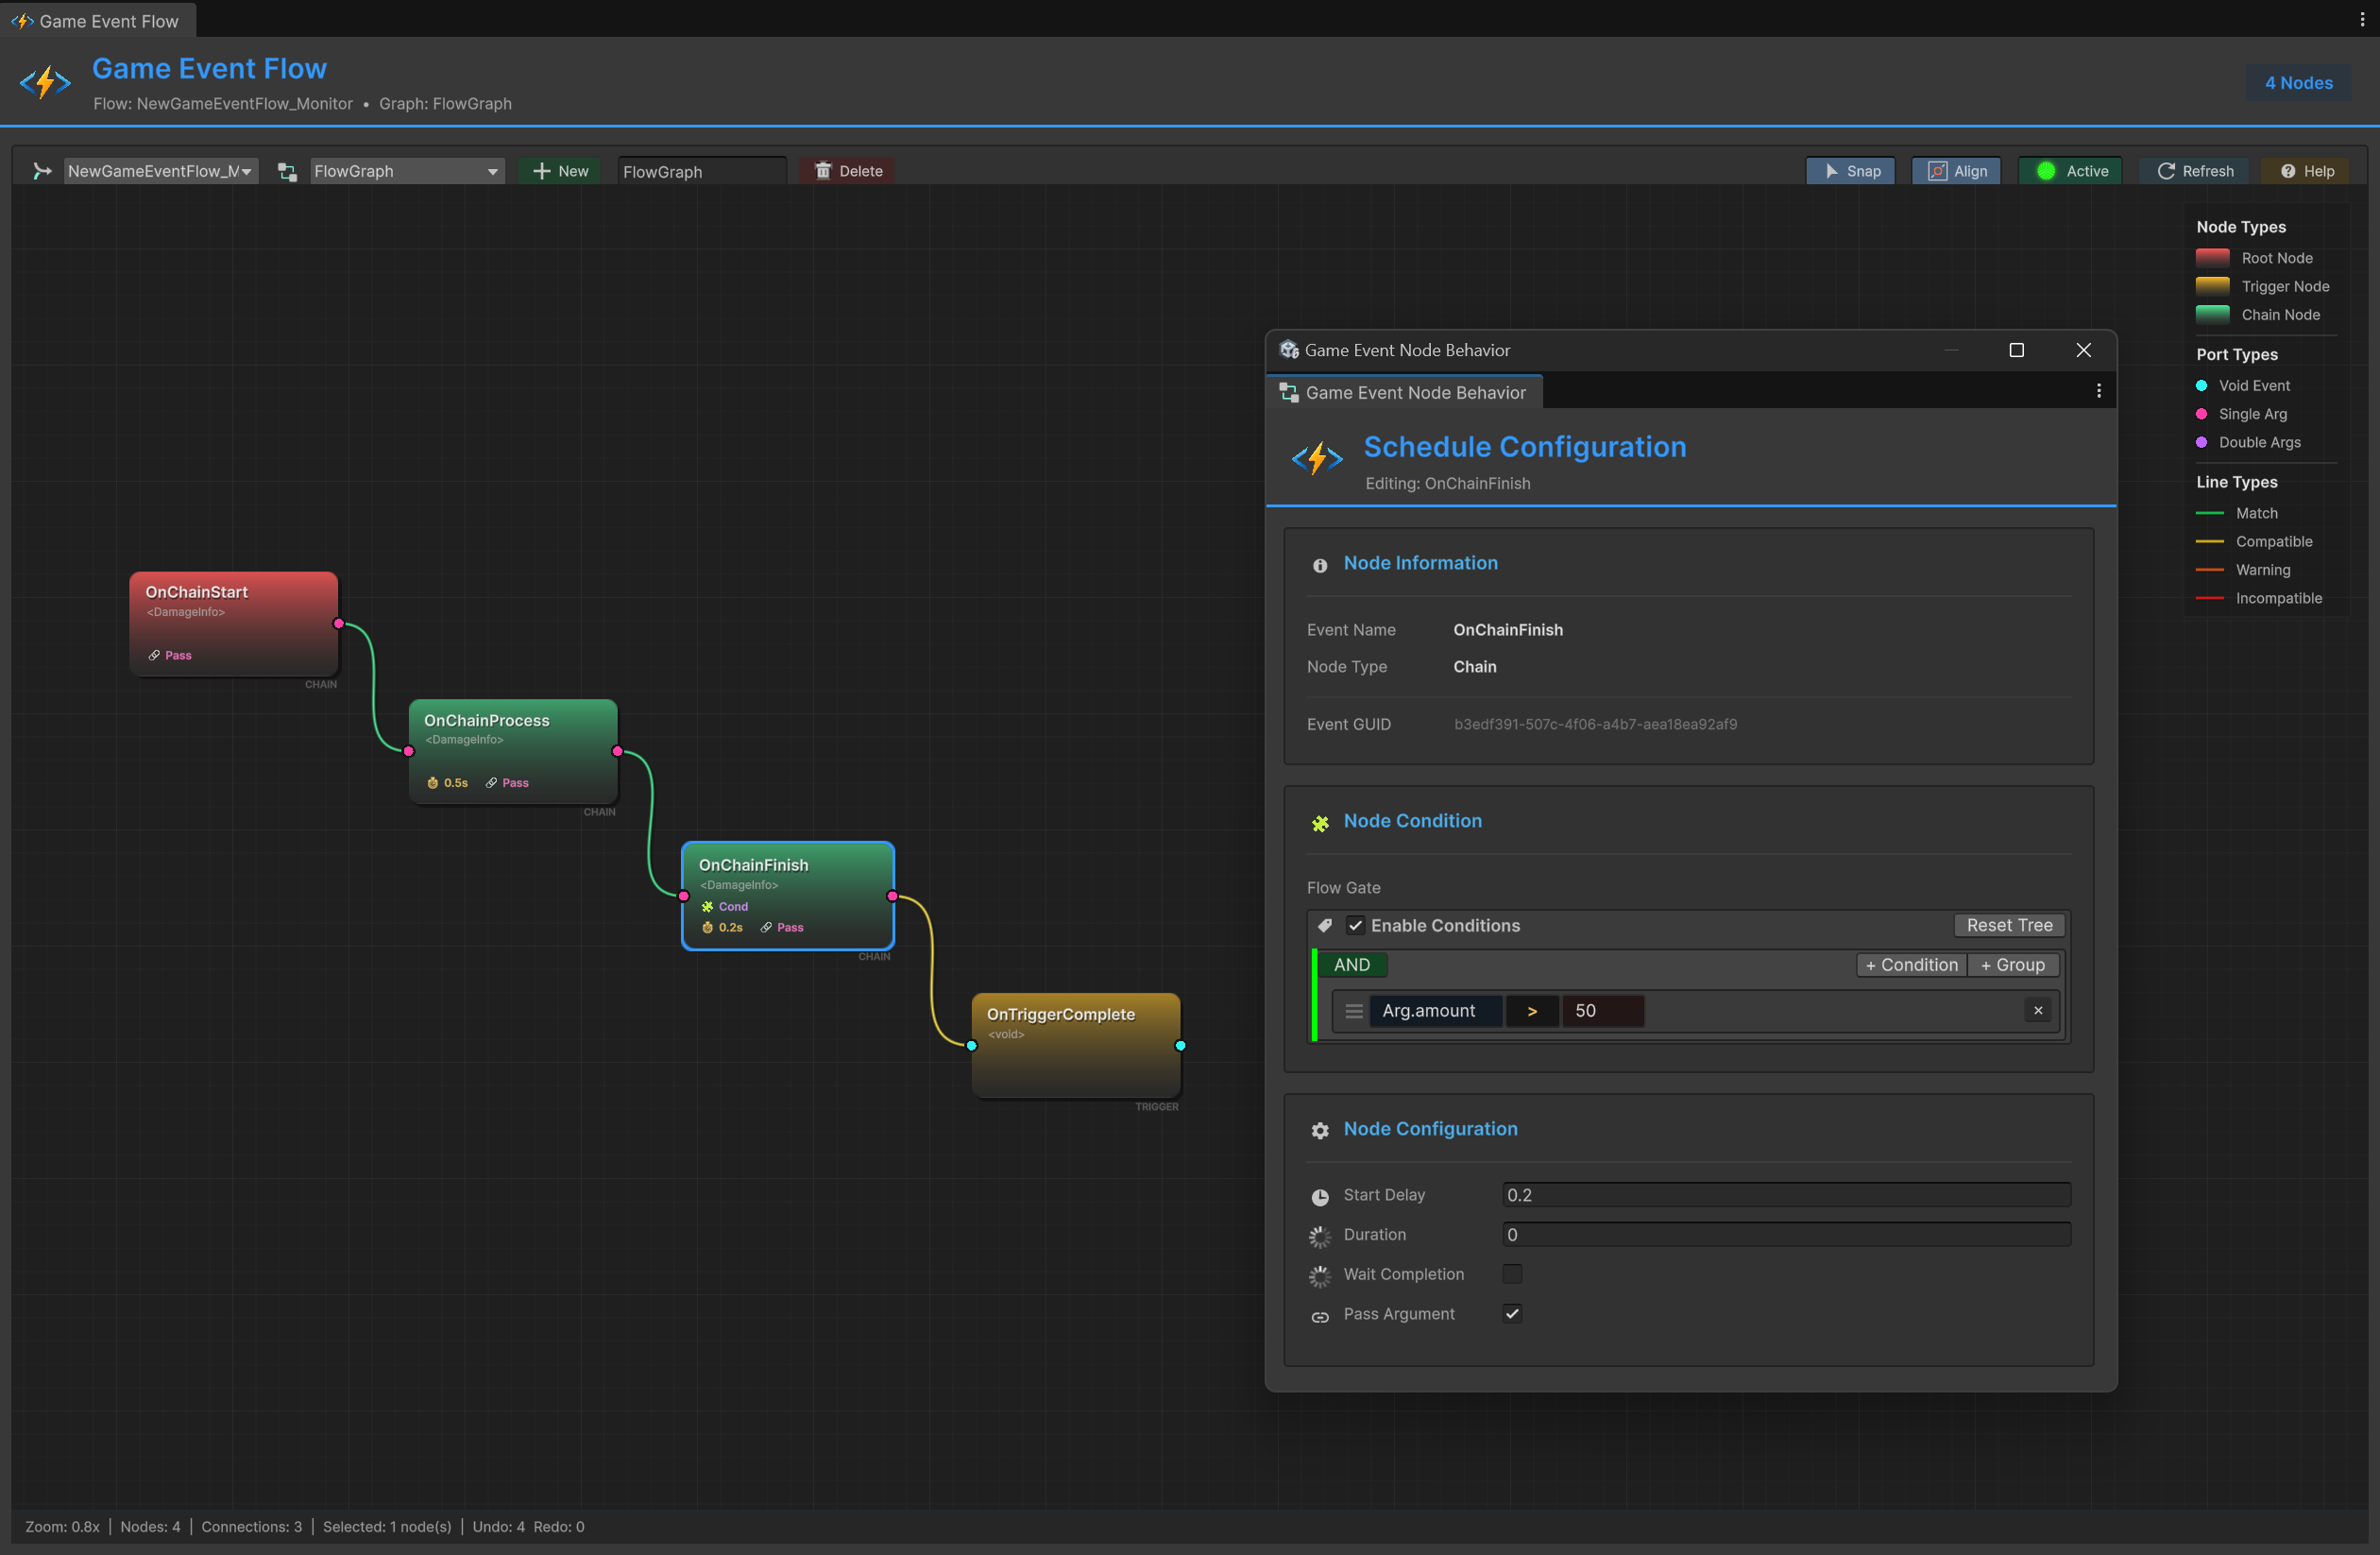
Graph Structure:
- 🔴 OnChainStart (Root, Red) - Entry point
- 🟢 OnChainProcess (Chain, Green) - Step 1 (Delay: 0.5s)
- 🟢 OnChainFinish (Chain, Green) - Step 2 (Delay: 0.2s, Condition: amount > 50)
- 🟡 OnTriggerComplete (Trigger, Yellow) - Step 3 (Argument blocked)
Connection Types:
- 🟢 Green "CHAIN" lines - Sequential execution
- 🟡 Yellow "TRIGGER" line - Parallel execution
Raiser Setup (RuntimeMonitorRaiser)
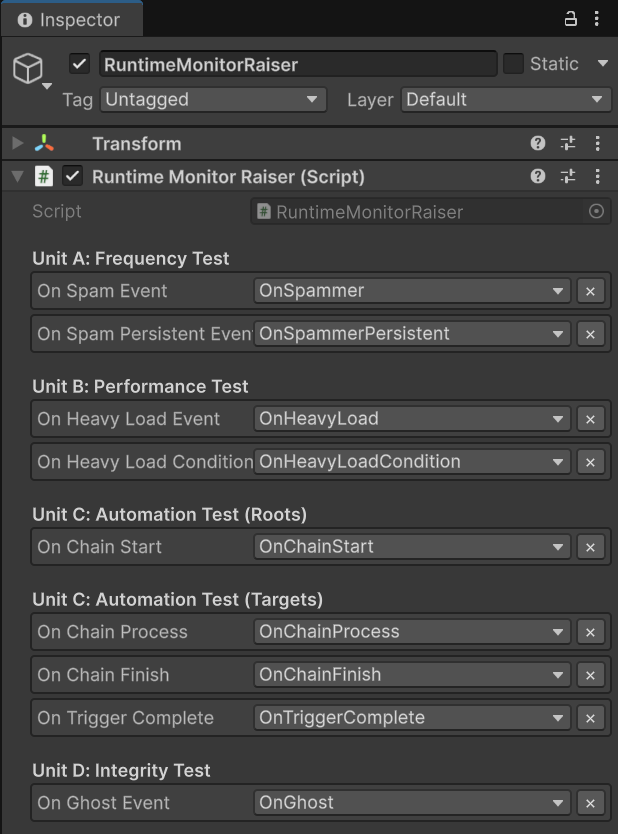
Unit A: Frequency Test
On Spam Event: OnSpammerOn Spam Persistent Event: OnSpammerPersistent
Unit B: Performance Test
On Heavy Load Event: OnHeavyLoadOn Heavy Load Condition Event: OnHeavyLoadCondition
Unit C: Automation Test (Roots)
On Chain Start: OnChainStart
Unit C: Automation Test (Targets)
On Chain Process: OnChainProcessOn Chain Finish: OnChainFinishOn Trigger Complete: OnTriggerComplete
Unit D: Integrity Test
On Ghost Event: OnGhost
Receiver Setup (RuntimeMonitorReceiver)
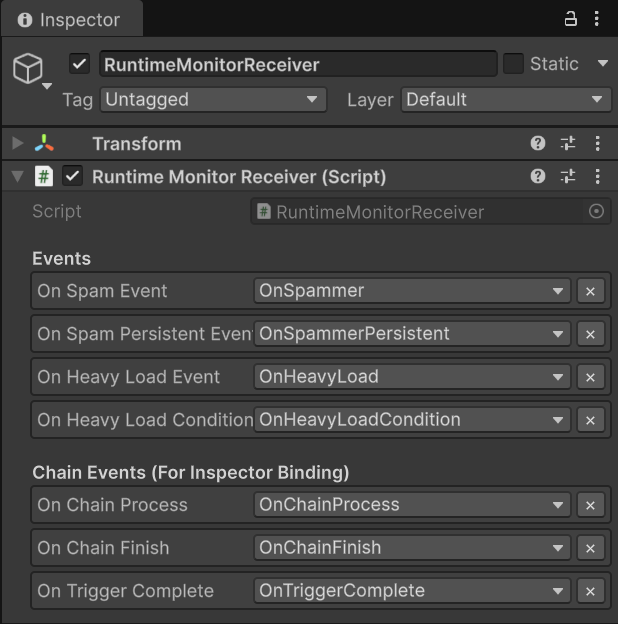
Events (Asset References):
- Same events as Raiser
Chain Events (For Inspector Binding):
On Chain Process,On Chain Finish,On Trigger Complete- These have Inspector-based listeners (drag & drop in Behavior window)
- Complements code-based API listeners
Code Breakdown
Simulating Performance Issues (Unit B)
RuntimeMonitorReceiver.cs - Heavy Execution:
public void OnHeavyExecution(GameObject sender, DamageInfo info)
{
    // ⚠️ INTENTIONAL LAG FOR TESTING
    // In production, NEVER use Thread.Sleep in game logic!
    // This forces execution time to >5ms to trigger Monitor warnings
    Thread.Sleep(6);  // ← Simulates expensive computation

    Debug.Log($"[Receiver] Processed heavy data. Latency: 6ms (simulated)");
}
Why this works:
Thread.Sleep(6)blocks main thread for 6 milliseconds- Monitor's Performance tab tracks execution time per listener
- 6ms exceeds 5ms threshold → triggers YELLOW warning
- Click button 2x with
Thread.Sleep(12)→ RED critical warning
Building Programmatic Automation (Unit C)
RuntimeMonitorRaiser.cs - Awake() Graph Construction:
private ChainHandle _chainProcessHandle;
private ChainHandle _chainFinishHandle;
private TriggerHandle _triggerCompleteHandle;

private void Awake()
{
    // ✅ BUILD CHAIN IN CODE (Not visual graph!)

    // Step 1: Start → (Delay 0.5s) → Process
    _chainProcessHandle = onChainStart.AddChainEvent(
        targetEvent: onChainProcess,
        delay: 0.5f,           // ← Pause for half a second
        passArgument: true     // ← Forward DamageInfo
    );

    // Step 2: Process → (Condition + Delay 0.2s) → Finish
    _chainFinishHandle = onChainProcess.AddChainEvent(
        targetEvent: onChainFinish,
        delay: 0.2f,
        condition: (info) => info.amount > 50f,  // ← Only high damage continues
        passArgument: true
    );

    // Step 3: Finish → (Trigger, Block Args) → Complete
    _triggerCompleteHandle = onChainFinish.AddTriggerEvent(
        targetEvent: onTriggerComplete,
        passArgument: false    // ← Block arguments (type conversion void)
    );
}

private void OnDestroy()
{
    // ✅ CLEANUP: MANDATORY for dynamic graphs
    onChainStart.RemoveChainEvent(_chainProcessHandle);
    onChainProcess.RemoveChainEvent(_chainFinishHandle);
    onChainFinish.RemoveTriggerEvent(_triggerCompleteHandle);
}
Graph Execution Flow:
🖱️ User Interaction: Button Clicked
│
🚀 [ INITIATION ] ➔ onChainStart.Raise(DamageInfo)
│   📦 Payload: { amount: 100, isCritical: true }
│
⏳ [ SCHEDULING ] ➔ System Pauses for 0.5s
│   └─► ⚙️ onChainProcess.Raise(DamageInfo)
│
⚖️ [ EVALUATION ] ➔ Gate: `100 > 50` ?
│   └─► ✅ Result: YES (Condition Passed)
│
⏳ [ SCHEDULING ] ➔ System Pauses for 0.2s
│   └─► 🎯 onChainFinish.Raise(DamageInfo)
│
🧪 [ PURIFICATION ] ➔ Parameter Stripping: `DamageInfo` ➔ `void`
│   └─► 🏁 onTriggerComplete.Raise()
│
📊 Final Outcome: Pipeline Finalized | ⚡ Timing: 0.7s Total Delay
Monitor Visibility:
- Automation Tab: Shows this exact tree structure
- Recent Events Tab: Shows sequential firing pattern with timing
- Performance Tab: Tracks each step's execution time
Registering Multi-Priority Listeners (Unit B)
RuntimeMonitorReceiver.cs - OnEnable():
private void OnEnable()
{
    // ✅ POPULATE LISTENERS TAB WITH VARIETY

    // Basic listener (no priority)
    onSpamEvent.AddListener(OnSpamReceived);

    // Priority listeners (execution order)
    onHeavyLoadEvent.AddPriorityListener(OnHeavyPreCheck, priority: 100);   // Runs 1st
    onHeavyLoadEvent.AddPriorityListener(OnHeavyExecution, priority: 0);    // Runs 2nd (lag here)
    onHeavyLoadEvent.AddPriorityListener(OnHeavyPostCheck, priority: -100); // Runs 3rd

    // Conditional listener with priority
    onHeavyLoadConditionEvent.AddConditionalListener(
        OnHeavyCriticalWarning,
        condition: (sender, info) => info.isCritical,  // ← Only if critical
        priority: 50
    );
}

private void OnDisable()
{
    // ✅ CLEANUP
    onSpamEvent.RemoveListener(OnSpamReceived);

    onHeavyLoadEvent.RemovePriorityListener(OnHeavyPreCheck);
    onHeavyLoadEvent.RemovePriorityListener(OnHeavyExecution);
    onHeavyLoadEvent.RemovePriorityListener(OnHeavyPostCheck);

    onHeavyLoadConditionEvent.RemoveConditionalListener(OnHeavyCriticalWarning);
}
Monitor Visibility:
- Listeners Tab: Shows 4 listeners for
OnHeavyLoad- Priority breakdown: High (1), Normal (1), Low (1)
- Conditional (1) with predicate preview
- Performance Tab: Tracks cumulative execution time (sum of all listeners)
Persistent Listener Management (Unit A)
RuntimeMonitorReceiver.cs - Awake/OnDestroy:
private void Awake()
{
    // ✅ PERSISTENT LISTENER (Survives scene reload)
    // Registered in Awake, cleaned in OnDestroy
    onSpamPersistentEvent.AddPersistentListener(OnSpamPersistentLog, priority: -10);
}

private void OnDestroy()
{
    // ✅ CLEANUP PERSISTENT
    onSpamPersistentEvent.RemovePersistentListener(OnSpamPersistentLog);
}

public void OnSpamPersistentLog()
{
    // Empty method—exists only for Monitor to count
    // Simulates background tracking (e.g., analytics, achievements)
}
Monitor Visibility:
- Listeners Tab: Shows "Persistent Listeners: 1" for
OnSpammerPersistent - Dashboard: Tracks persistent listener health
Production Debugging Workflow
Scenario 1: Frame Drops During Combat
Symptoms:
- FPS drops from 60 to 30 during combat
- No obvious Unity Profiler spikes
Debug Steps:
- Open Performance Tab
- Sort by "Avg Time" (descending)
- Look for events with >2ms execution
- Click event → Details Tab → See caller methods
- Optimize heavy listeners or reduce fire frequency
Scenario 2: Event Not Firing
Symptoms:
- UI button click does nothing
- Expected behavior doesn't occur
Debug Steps:
- Open Recent Events Tab
- Search for expected event name
- If found: Event firing but listeners not responding
- Go to Listeners Tab → Check listener count
- Verify method names match
- If not found: Event not being raised
- Check raiser code's
.Raise()call - Verify event asset reference in Inspector
- Check raiser code's
Scenario 3: Memory Leak Suspected
Symptoms:
- Memory usage grows over time
- GC spikes increase
Debug Steps:
- Open Performance Tab
- Check "GC Alloc" column
- Look for events allocating >0 KB per fire
- Click event → Listeners Tab → Check for closure allocations
- Refactor to avoid per-fire allocations
Scenario 4: Ghost Events (Dead Code)
Symptoms:
- Warning tab shows
[No Listeners]
Debug Steps:
- Open Warnings Tab
- Identify ghost events
- Option A: Event is debug-only → Ignore warning
- Option B: Listener registration failed
- Check
OnEnableforAddListenercall - Verify event asset reference matches
- Check
- Option C: Dead code → Remove
.Raise()call
Monitor Best Practices
DO
During Development:
- Keep Monitor open in second display
- Check after adding new events
- Verify listener counts match expectations
- Profile before/after optimizations
During Stress Testing:
- Generate high load (like this demo)
- Monitor Performance tab for >1ms events
- Check Warnings tab for integrity issues
- Export metrics for team review
In Production Builds:
- Enable Monitor in Development Builds
- Test on target devices (mobile, console)
- Profile in realistic scenarios
- Document performance baselines
DON'T
Performance Anti-Patterns:
- Fire events every frame (>60/sec) without batching
- Allocate memory in listeners (closures, LINQ)
- Call expensive operations synchronously
Debugging Anti-Patterns:
- Ignore yellow warnings ("it's just a warning")
- Rely solely on
Debug.Logfor event debugging - Skip listener cleanup (
OnDisablemissing) - Leave test events in production builds
Monitor vs Unity Profiler
| Feature | Game Event Monitor | Unity Profiler |
|---|---|---|
| Focus | Event system only | Entire engine |
| Granularity | Per-event metrics | Per-method calls |
| Listener Tracking | ✅ Built-in | ❌ Manual |
| Frequency Analysis | ✅ Built-in | ⚠️ Indirect |
| Flow Visualization | ✅ Automation tab | ❌ N/A |
| Warnings | ✅ Automatic | ❌ Manual analysis |
| Learning Curve | Easy | Steep |
| Best For | Event debugging | Overall performance |
Recommended Workflow:
- Monitor: Identify problematic events
- Unity Profiler: Deep-dive into listener methods
- Monitor: Verify fixes reduced execution time
Related Documentation
- Runtime Monitor Tool - Complete Monitor documentation
- Best Practices - Performance optimization patterns
- Programmatic Flow - Building graphs in code
- API Reference - Complete method signatures